
The July labor market and consumer price reports were met with a sigh of relief. A reduced pace of labor market hiring and deceleration in the CPI—both headline and core measures—were viewed as pointing to a “soft landing”— a return to low (2 percent) inflation without a recession.
Does a careful assessment of recent data suggest that a soft landing is the most likely scenario?
The chart below—plotting twelve-month increases in headline (blue line) and core (red line) CPI prices—shows that headline inflation was 3.2 percent last month, down from a peak of 8.5 percent, and core inflation was 4.7 percent, down from 6.6 percent. Moreover, headline inflation was only 1.8 percent annually over the past three months—even below the Fed’s 2 percent target—while core inflation was 3.0 percent. Meanwhile, employment expanded by 187 thousand in July—about the same pace as in June—well below the pace of earlier months but still above the growth in hiring needed to keep the jobless rate stable.

We can split the CPI into commodity prices (excluding volatile food and energy prices) and service prices (excluding energy prices). Twelve-month increases in each of these components are visible in the following chart. The blue line shows that service-price inflation has slowed only slightly over recent months to 6.1 percent, roughly three percentage points above the rate service prices were rising before the pandemic when overall inflation was subdued. Moreover, the red line of commodities price inflation has dropped considerably more.

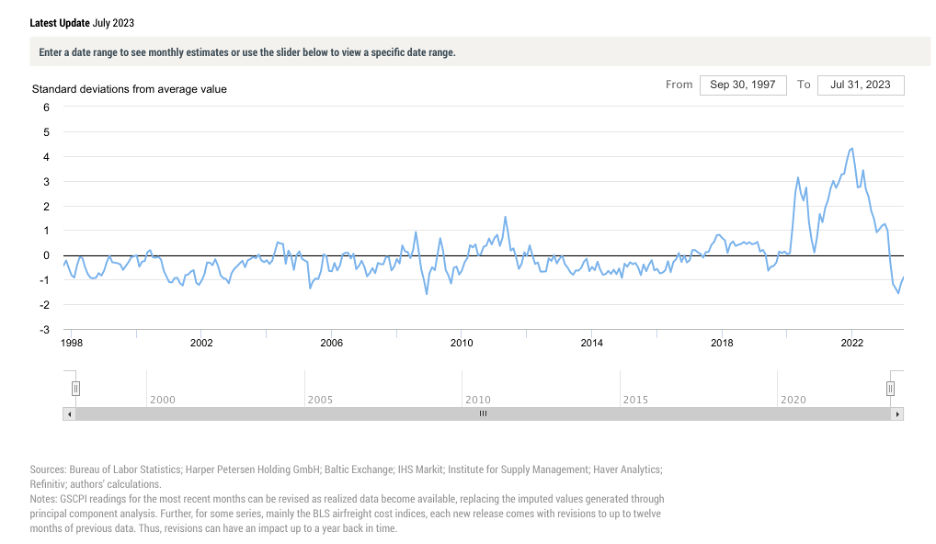
However, much of the drop in commodity price inflation owes to an unwinding of supply-chain snarls which cannot last much longer. The chart below presents the New York Fed’s index of supply chain pressures and shows that supply chain pressures have abated sharply into the summer. The easing of supply chain pressures has been a major force behind the dramatic slowing of commodity price inflation (commodity prices were flat over the three months ending in July), and this force is likely drawing to an end. Thus, it is reasonable to expect that commodity price inflation will pick up from the recent pace and settle in at a rate that exceeds the pre-COVID rate, which was very low (roughly zero).
The above discussion implies that service prices continue to rise much more rapidly than is consistent with Fed’s target for overall inflation and that commodity prices are likely to accelerate in the coming months.
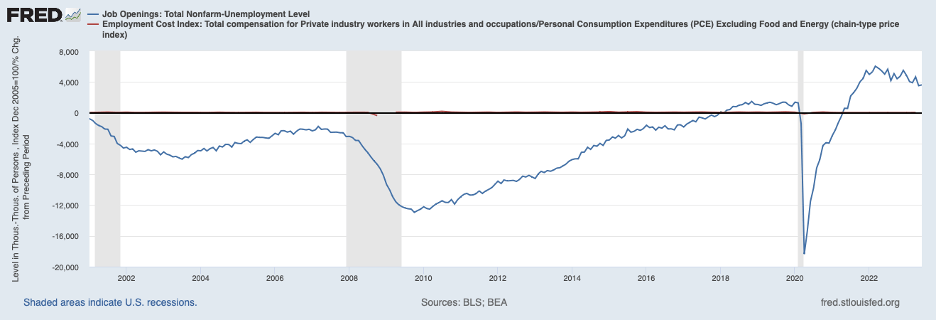
Turning to the labor market, evidence of excess demand for labor persists, as shown in the chart below. The chart, presenting the excess of job openings over the number of unemployed persons, shows that this highly unusual imbalance has eased only a bit this year.
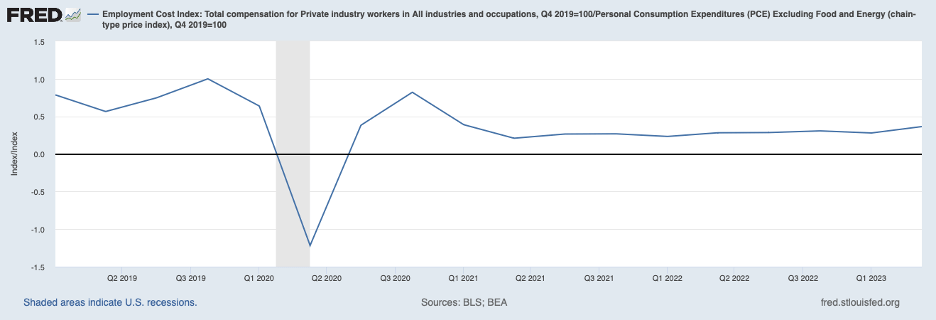
This excess demand has undoubtedly been exacerbated by subdued real wages, shown in the following chart. This chart shows an index of compensation per hour divided by an index of core PCE prices. The chart shows that, despite a recent mild increase of late, real wages are well below the pre-pandemic level—that is, compensation increases have lagged behind prices.
This decline in real wages has happened even as labor productivity has risen at around a 2 percent annual rate over this period, and increasing productivity should be boosting real wages (implying 5 percent higher, not lower, real wages than just before the pandemic).
The imbalance in the labor market cannot persist indefinitely and points to the need for a sizable downward shift in job openings—a recession—or the need for wages to start rising a bit faster than prices (putting upward pressure on business costs).
Another indicator suggesting that the Fed’s inflation battle is not over is the federal funds rate derived from a Taylor rule—an algorithm utilizing a measure of the excess of actual inflation over the Fed’s target rate of 2 percent and a measure of economic slack (or the degree to which the economy is being strained by overheating the current situation).
The chart below shows the federal funds rate implied by three versions of the Taylor rule (blue, yellow, and green lines) provided by the Federal Reserve Bank of Atlanta and the actual federal funds rate (red line).
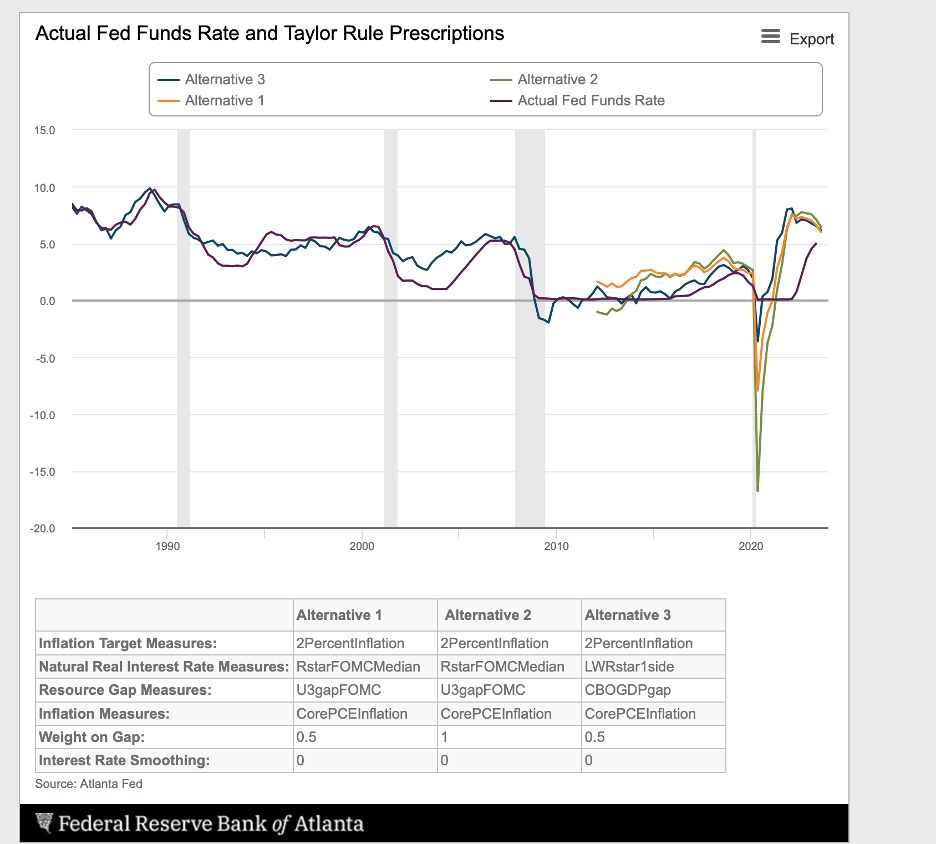
The chart shows that all three versions of the Taylor rule call for a federal funds rate of around 6 percent, more than ½ percentage point above the current rate. Moreover, these versions of the Taylor rule have been calibrated using data primarily from periods when inflation was not persistently and stubbornly high, suggesting that they may be yielding an underestimate of what it will take to break the back of inflation.
In sum, one cannot rule out the prospect that a soft landing is in store. But if a soft landing occurs, we must rethink our understanding of inflation and macroeconomic adjustment. Standard economic models imply that inflation expectations must decline to match the Fed’s 2 percent target or that a significant degree of economic slack must emerge to put downward pressure on wages and prices.
The following chart shows a measure of longer-term inflation expectations based on yields in the Treasury securities market. The chart indicates that, even though expectations are above what they were before COVID when inflation was subdued, a return to the level of expectations during the subdued-inflation period would not be sufficient.
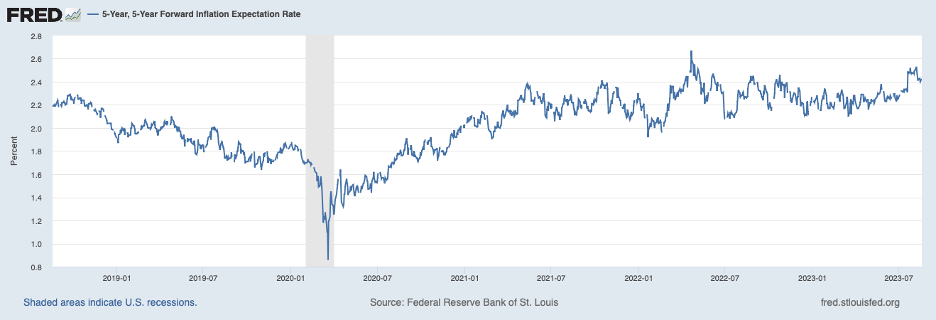
In other words, inflation expectations need to drop only around ½ percent to return to pre-COVID territory, much less than actual inflation needs to drop to return actual inflation to 2 percent. Thus, there must be a significant swing in the labor market imbalance from the current excess demand to one of excess supply—slack in the labor market— to achieve the Fed’s 2 percent inflation target, according to standard models. In other words, based on historical experience and standard models, a hard landing will be needed to get back to low inflation—contrary to current euphoric thinking.
