
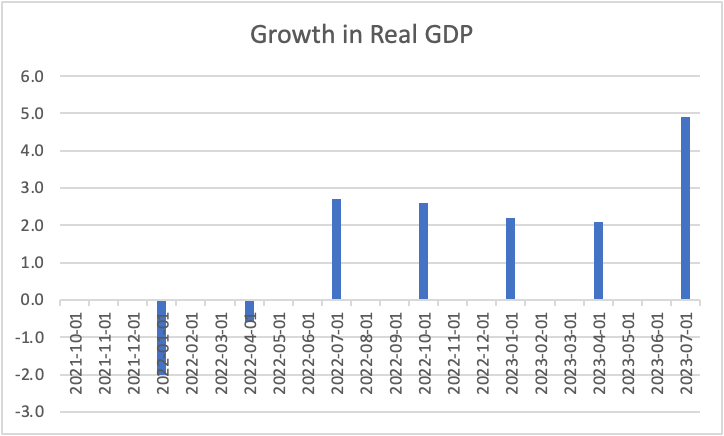
The pickup in growth of real GDP to nearly 5 percent in the third quarter, illustrated in the chart below, got a lot of attention. This growth was especially notable since many forecasters had come to expect a recession in the latter part of this year, largely brought on by the Fed’s policy tightening measures that began in March 2022. Moreover, the limited data available for the fourth quarter point to continued growth above the sustainable growth rate of output of nearly 2 percent per year.
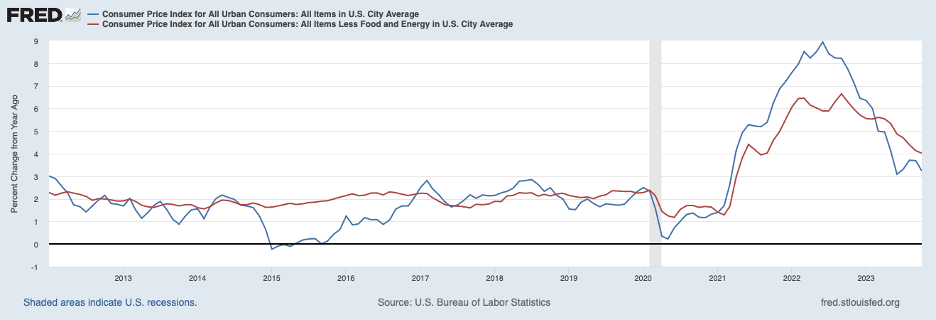
Meanwhile, inflation data have continued to be favorable through October. Next are the twelve-month percent changes in the headline CPI (the blue line) and the core CPI (the red line). Headline inflation dipped back to 3.3 percent in October, down from a peak of 8.9 percent in June 2022, while core inflation drifted down to 4.0 percent from a peak of 6.3 percent a year earlier in October 2022. Even better, the three-month core CPI inflation rate (from July to October) was only 3.4 percent, drawing closer to the Fed’s 2 percent target.
Slowing growth in output and deceleration in consumer prices has led to a widespread belief that we are experiencing a soft landing —moving down to the Fed’s 2 percent target for inflation while avoiding a recession and job losses. In other words, the Fed’s measured policy tightening has threaded the needle by conquering inflation while keeping the economy and labor market afloat.
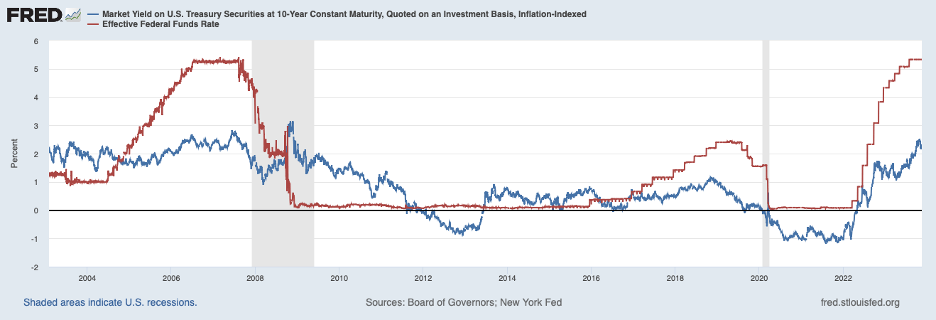
The Fed’s policy tightening can be seen by the red line in the chart below. Since mid-March 2022, the Fed has raised its nominal overnight federal funds target by 5.25 percentage points. Over that same time, the real yield on the ten-year Treasury note rose 3.1 percentage points from -0.8 to 2.3 percent. Three-fourths of that increase occurred over the six months or so immediately after the tightening began.
Economists believe that, at the end of the day, businesses and households respond to movements in real interest rates by making spending decisions that drive growth in output. Since the initial (three-fourths) impact was completed more than a year ago, it seems safe to conclude that the bulk of the effect of higher real rates on spending has already been realized.
Contributing to the pickup in GDP growth in the third quarter was an upturn in consumer spending (personal consumption expenditures, PCE) over the June-to-September period, shown next. Indeed, consumption over the third quarter ended on a high note in September. (The strength in PCE in September means that the fourth quarter started at an elevated level in relation to the average level of consumer spending in the third quarter, meaning that the fourth quarter average is off to a good start). Thus, to the degree that higher real interest rates were restraining consumer spending, that restraint appears to have abated. (Note that the retail sales data for October imply that the September increase in PCE will be revised upward, but that increase was followed by sluggish consumer spending in October).

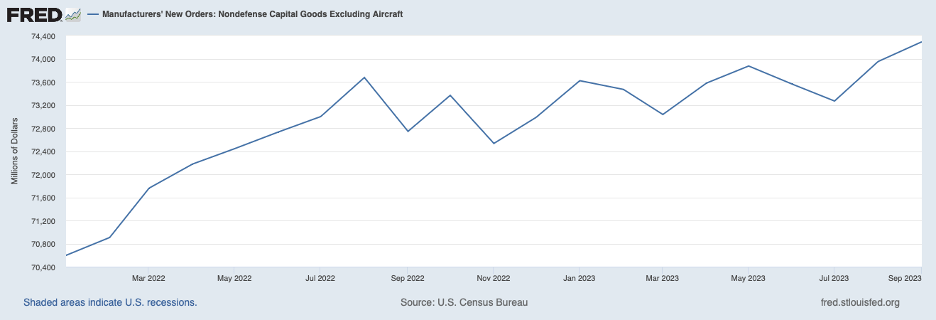
Business spending on capital goods has also been firming of late. The following chart shows new orders for capital goods (excluding defense orders and volatile aircraft orders). These orders leveled off after the Fed began tightening in March 2022 but have increased in the past few months.
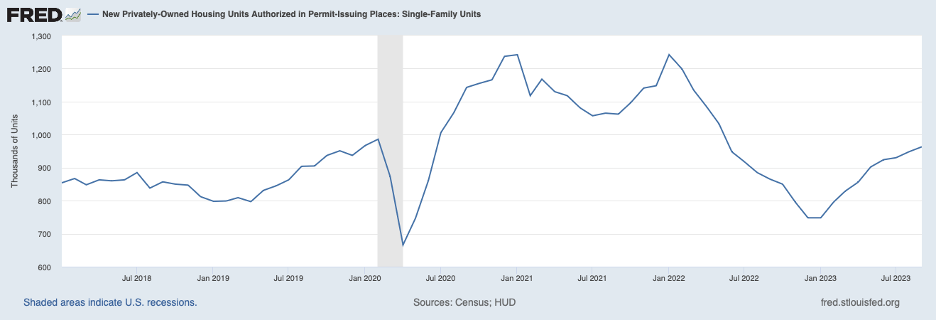
A similar story can be told about the housing sector. The following chart shows single-family housing permits, which declined over 2022, owing largely to the increase in interest rates. However, permits have been on an upswing in 2023, returning to pre-pandemic levels. Historically, The housing sector has been one of the sectors most impacted by tighter monetary policy but is displaying remarkable buoyancy.
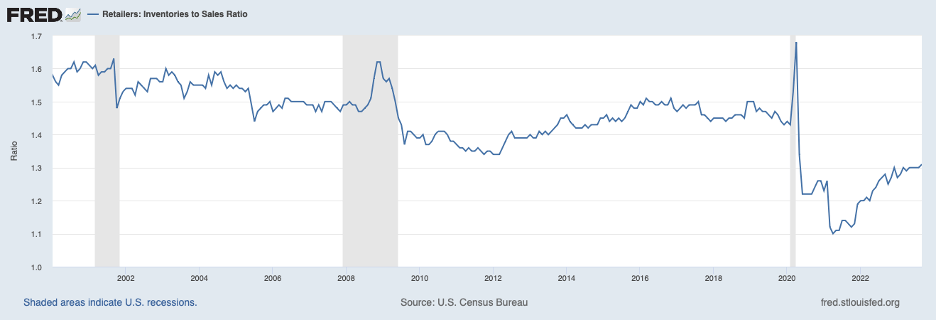
The need to restock inventories in the months ahead will place pressure on resources beyond growth in business and household spending. The following chart shows the retail inventory-to-sales ratio. Following the onset of the pandemic in early 2020, supply-chain disruptions caused retail shelves to be depleted, which prompted retailers to rebuild stocks. However, their efforts to date have been only partially successful, and there is a lot of inventory rebuilding ahead.
Inventory investment over the third quarter added 1-1/4 percentage points to the 4.9 percent growth in output that quarter and will continue to boost growth in real GDP in the coming quarters fueling strains on the labor and other resource markets.
Turning to the labor market, the October employment report showed a slowing in employment growth, exaggerated by the UAW strike. Nonetheless, after allowing for strike effects, the increase in employment substantially exceeded the increase in new entrants to the labor force, maintaining pressures on the labor market.
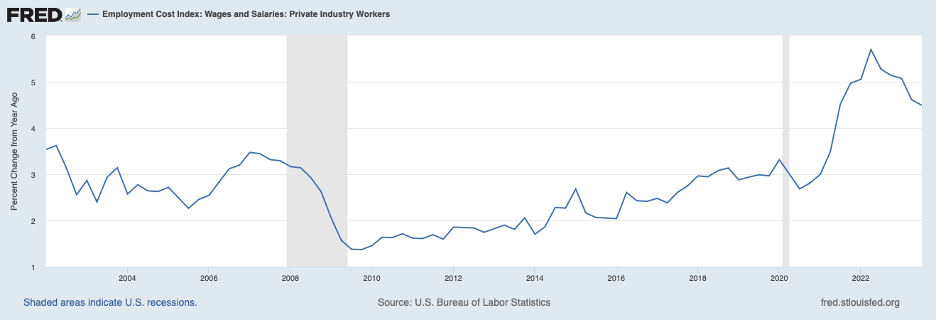
The following chart presents data through the third quarter on labor compensation based on the employment cost index (ECI, the most reliable measure of compensation). The four-quarter percent change has slowed but still has outpaced the pre-pandemic period by roughly 1-1/2 percentage points, suggesting that still-large increases in labor compensation are not compatible with the Fed’s 2 percent target for inflation. (Although compensation grew at a slower pace in the third quarter than over the year ending in the third quarter, the UAW settlement will be adding to compensation growth in the period ahead).
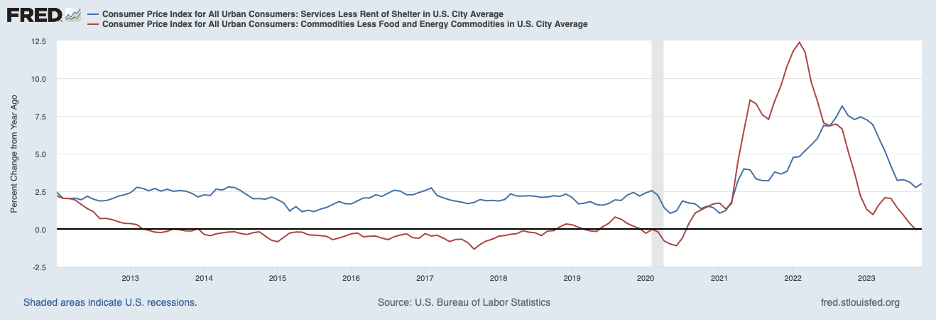
A decomposition of the core CPI also suggests that caution should be exercised in declaring victory in the war against inflation. The following chart displays the twelve-month increase in service prices excluding housing costs (blue line) and in commodity prices excluding food and energy prices (red line). Growth in service prices, which has a large labor cost component, had leveled off in recent months to around 3 percent on a twelve-month basis but has actually picked up to a 4 percent pace over the past three months.
Turning to the commodity price component of the CPI, the deceleration in commodity prices has contributed significantly to the slowing of core price inflation in recent months but likely will not continue to do so; over the past three months, these prices have actually declined at a 3.2 percent annual rate, benefitting from an easing of supply chain bottlenecks, but cannot be expected to continue to decline at this rate.
To an important extent, favorable inflation developments in response to Fed tightening owe to well-behaved inflation expectations. The following chart from the Michigan survey shows consumer expectations of inflation over the coming five years. Those expectations have been fairly stable over the past year.
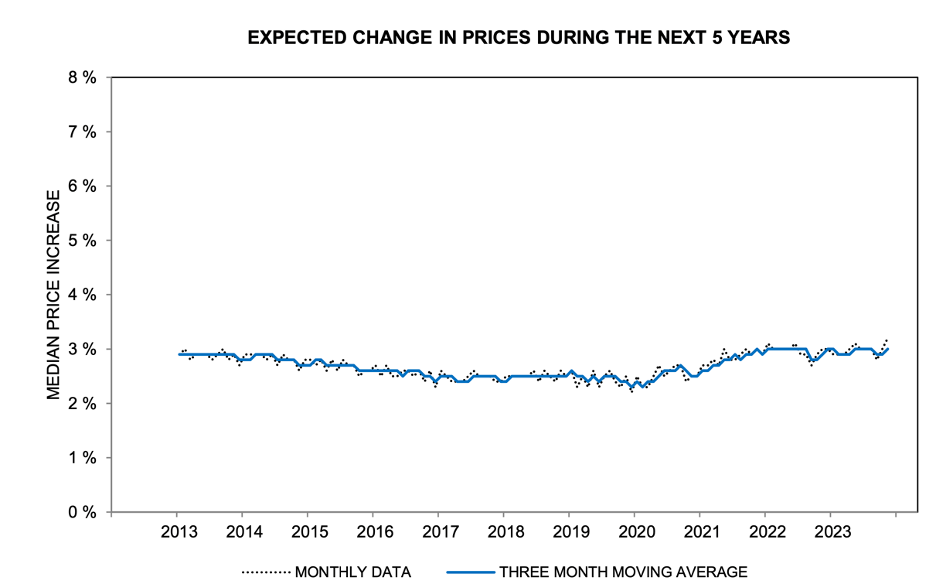
Source: Survey Research Center, University of Michigan.
The next measure of inflation expectations, shown in the chart below, is for the five-year period starting in five years and is derived from Treasury securities market data. This measure has edged up over the past year but has been relatively stable over the past couple of years.
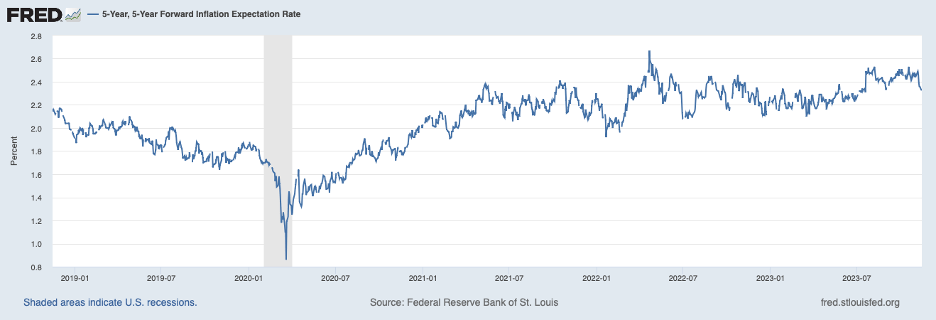
It should be noted, however, that both measures of inflation expectations are above their levels before the pandemic shock and will need to retreat somewhat to be aligned with the Fed’s 2 percent target if the Fed is to achieve 2 percent inflation on a sustainable basis.
In sum, the economy still has momentum, and a recession is not around the corner. Moreover, there are indications that the disinflation process may be coming to an end, and inflation is topping out at a rate that exceeds the Fed’s target. Worth mentioning is that the disinflation process is not fully understood, and historically, inflation has displayed unexplained stubbornness that cannot be ignored. Perhaps this is what some of the indicators mentioned above are saying.
Indeed, the pandemic shock to both supply and demand and the policy responses that followed are unprecedented, and the current inflation episode may turn out to be an exception to historical patterns. However, the stakes are very high if the Fed fails to restore price stability, and these high stakes call for resisting the urge to start cutting interest rates just because there has been a favorable run of data over a relatively short period of time.
—
Header Image: Kimi Lee/Unsplash
