The CPI for March again came in above the expectations of market participants and at least some Fed policymakers. Consequently, expectations for Fed policy rate cuts have been pushed back. Instead of expecting the first cut in the target for the federal funds rate from its current 5-1/4 to 5-1/2 percent range in June, market participants now see that rate cut coming in September and foresee even odds of another rate cut by year-end. In contrast, a short while ago, market participants expected that the Fed would cut the policy rate three times — by 75 basis points — before year-end.
The rethinking of the outlook for the federal funds rate over the next two years can be seen in the recent movement of the yield on the two-year Treasury note, shown in the chart below.

This yield can be thought of as the average level of the federal funds rate expected over the next two years. The two-year note yield is currently a shade below 5 percent, roughly 40 basis points lower than the current federal funds rate level. The rate on the two-year note has risen roughly 40 basis points since mid-March, indicating that market participants now expect the federal funds rate to be around 40 basis points higher over the next two years than they thought just a few weeks ago. Given unexpected inflationary pressures, do markets have things pegged correctly, or will it take more monetary restraint over the next couple of years for the Fed to subdue those inflationary pressures and restore price stability?
CPI Data
Headline CPI inflation was 0.4 percent in March, 0.1 percent (or 1.2 percent at an annual rate) above expectations. As shown by the blue line in the chart below, this increase brought the twelve-month change in the CPI to 3.5 percent, down from 5.0 percent a year earlier but well above the Fed’s 2 percent target for inflation. Similarly, the core CPI — that excludes volatile food and energy prices — rose 0.4 percent last month, also 0.1 percent above market expectations.
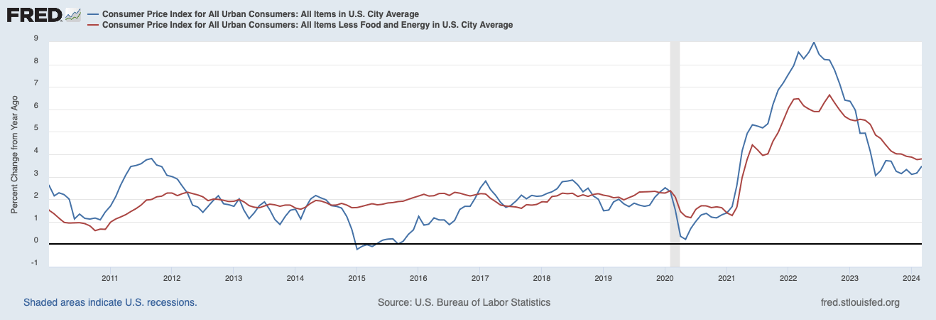
This kept the twelve-month change in core CPI prices at 3.8 percent as shown by the red line in the chart above. Moreover, the table below shows that the increase in both CPI measures over the past three months has been faster, when converted to annual rates, than over the past twelve months, posing the question of whether progress in lowering inflation has come to an end.

Getting a bead on underlying inflation has been complicated by cross currents caused by supply-chain disruptions affecting consumer commodity prices and confusion regarding the trend in the important rent component of service prices. Some evidence suggests that rents are in the process of moderating more than the rent of shelter component of the CPI has been showing.
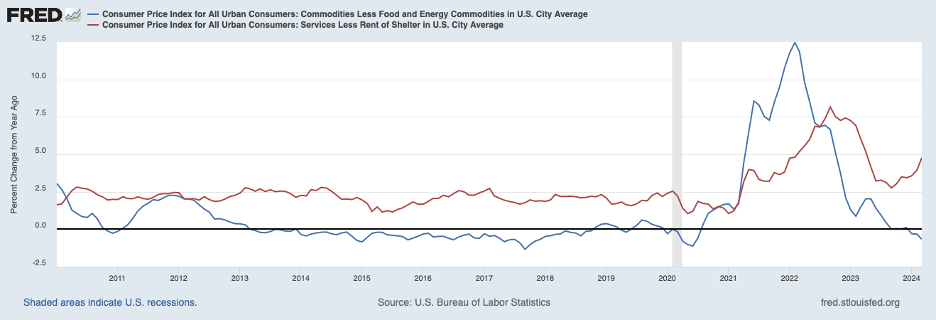
The following chart sheds some light on underlying inflation trends. The blue line shows the twelve-month change in CPI commodity prices less food and energy. These prices declined 0.7 percent over the twelve months ending in March and at an even faster rate over the three months ending in March. This suggests that the unwinding of supply-chain pressures on consumer goods prices may not have been completed in March. If so, the favorable effect of unwinding supply-chain pressures on the CPI may be drawing to an end.
Service Prices
Turning to service prices, the twelve-month increase in service prices, excluding rent of shelter shown by the red line above, continued rising in March — to 4.8 percent. Moreover, as shown in the table above, this measure of service prices accelerated to a 9.0 percent annual rate over the three months ending in March. The conclusion seems to be that progress in bringing underlying inflation down to the Fed’s 2 percent target evidently has, at best, stalled.
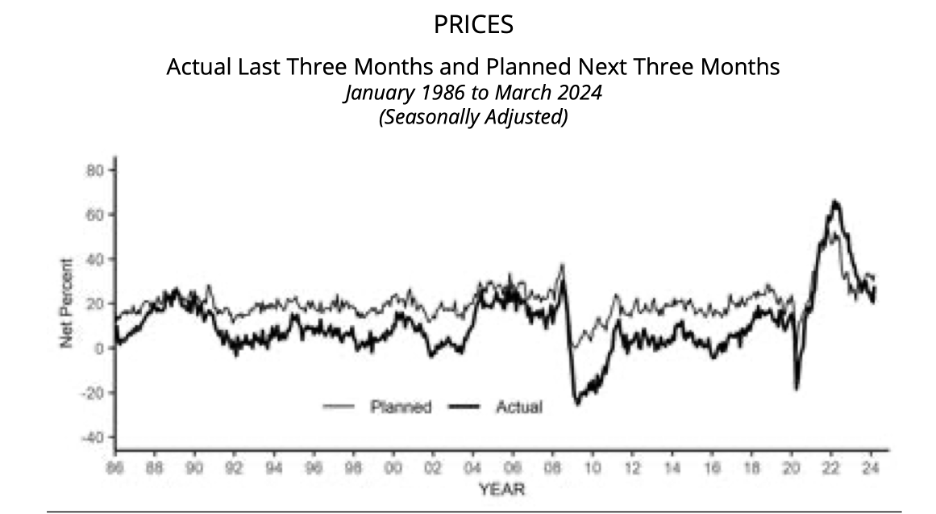
The results of the National Federation of Independent Business (NFIB) survey of its members for March, shown in the next chart, support the view that progress in lowering inflation has stalled. The black line shows that the percentage of respondents who have raised prices in the past three months has turned up after an extended period of declines—broadly tracking earlier declines in CPI inflation. Moreover, the percentage of respondents intending to raise prices over the next three months has also turned up recently, consistent with renewed inflationary pressures.
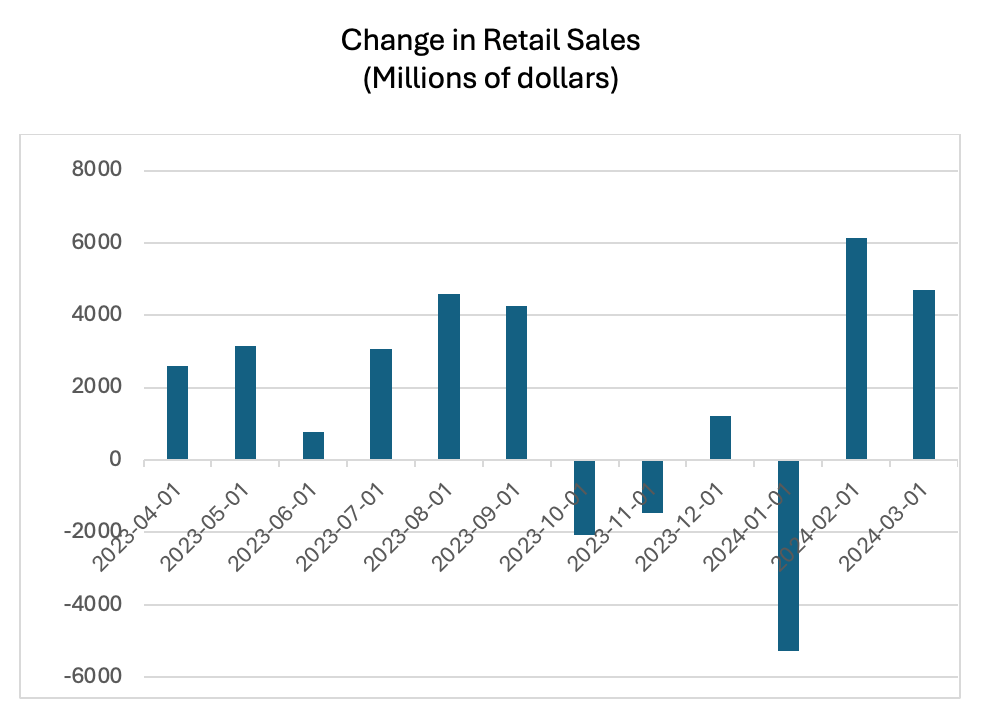
Recent spending and labor market news suggest that the economy still has forward momentum. Shown in the chart below are changes in retail sales over the previous twelve months. After a lull in retail spending in the final months of 2023 and January 2024 and perked up in February and March.
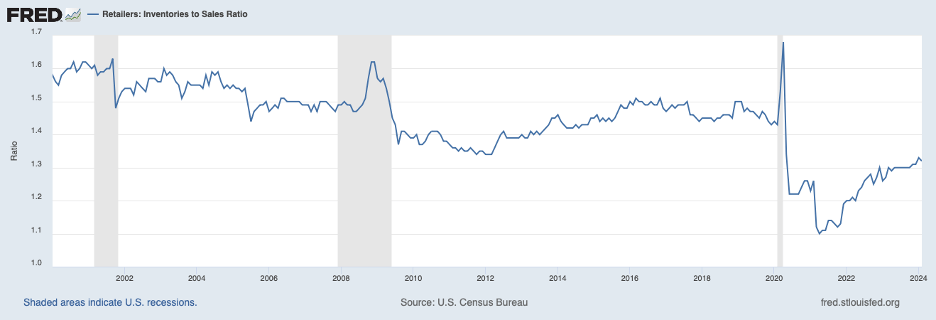
With generally solid increases in consumer purchases, retailers have been struggling to rebuild inventories, as shown by the retail inventory-to-sales ratio below. A COVID-related surge in consumer spending on goods led to depleted retailer shelves causing a significant drop in inventories relative to sales. As a result, retailers have been attempting to restock but have made only limited progress thus far. As they continue rebuilding efforts, they will be boosting production and pressure on resources.
The Labor Market
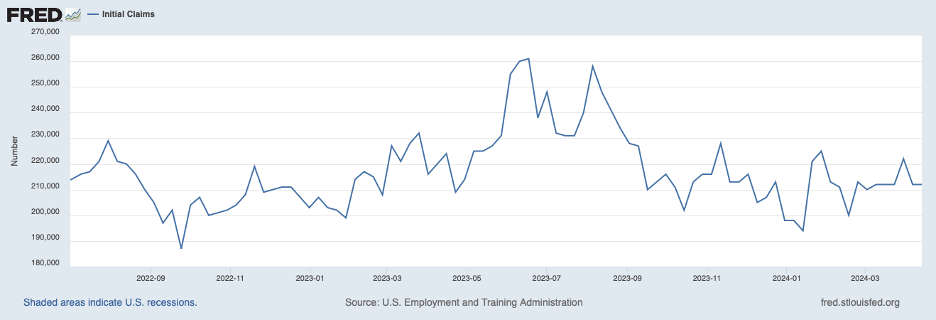
Furthermore, labor market indicators remain robust. Employment gains strengthened over the first three months of the year and ran well above the rates that would just absorb new labor force entrants. Moreover, initial claims for unemployment insurance, shown in the following chart, have stayed at very low levels by historical standards through mid-April.
The evidence in hand suggests that growth in output was nearly 3 percent at an annual rate in the first quarter and that there is ongoing momentum extending into the current quarter. Clearly, output growth will need to slow if there is to be a resumption in the disinflationary process. (The rate at which the economy can grow without adding to inflation pressures may currently be a little above 2 percent owing to a surge in immigration which is adding to growth in the labor force.)
Rapid output growth and stubborn underlying inflation suggest that interest rates are not high enough to slow growth sufficiently to place inflation on a discernable downward path. The following chart shows the real interest rate on a ten-year Treasury inflation-protected security (TIPS yield) which serves as a benchmark for a wide variety of interest rates that affect business and household spending decisions.
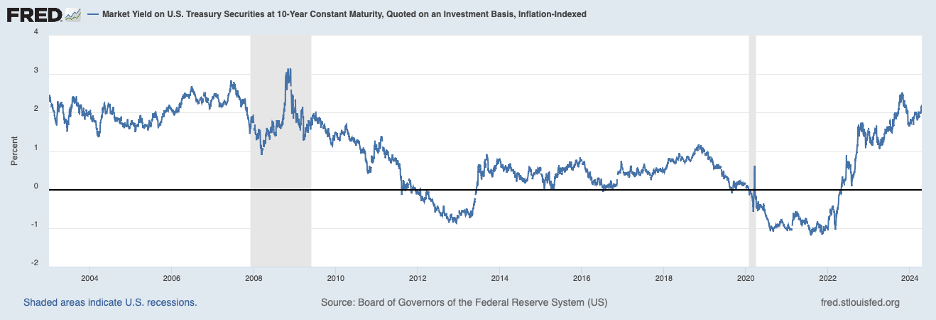
The TIPS rate has risen only mildly most recently as the bad news on inflation has led to a reassessment of the outlook for Fed policy. Notably, the current level of the ten-year TIPS yield is only about 60 basis points above the rate that prevailed in the fall of 2022 and is broadly in line with its level in the early 2000s when inflation was not as entrenched.
In light of these considerations, it would appear that the real interest rate will need to rise further for underlying inflation to be placed on a trajectory toward the Fed’s 2 percent target. Statements made by Fed officials indicate that the Fed is of the view that the needed additional monetary restraint can be achieved by reshaping expectations of market participants in a way that leads them to expect the current stance of policy to be in place longer than thought previously. However, this approach may not be enough and may require the Fed to move the policy rate higher. Fed Chair Powell previously mentioned that he believed that the policy rate had peaked for this tightening cycle. And the Fed has had a longstanding reluctance to reverse course. However, the sooner the Fed conveys that the policy rate may well have to be increased, the faster will be the needed market adjustments that will slow spending and return underlying inflation to a disinflationary path. Delays in delivering this message risk even more intransigent inflation.
—
Header image courtesy of Vladimir Solomianyi/Unsplash
