
A short while ago, the thinking inside and outside the Fed was that the economy was slowing, the labor market was cooling, and underlying inflation was on a clear downward path to the 2 percent target. Concern had been growing that the pendulum might be swinging too far in the direction of labor market cooling and unnecessary slack in the economy. This view contributed to the September 18 surprise 50 basis point cut in the Fed’s policy interest rate.
However, recent news has indicated that economic growth remains brisk, the labor market remains firm, and underlying inflation remains stubbornly high. Simply, there is some momentum that poses a policy challenge.
The table below shows growth in real GDP in the third quarter, as estimated by the Federal Reserve Bank of Atlanta, to have picked up from the solid pace of the first half of this year to nearly the brisk pace of 2023.

Moreover, the interest-sensitive components of aggregate demand are showing some buoyancy. Business investment spending and homebuilding, shown by the following chart on single-housing permits, have been contributing to recent strength in the economy.

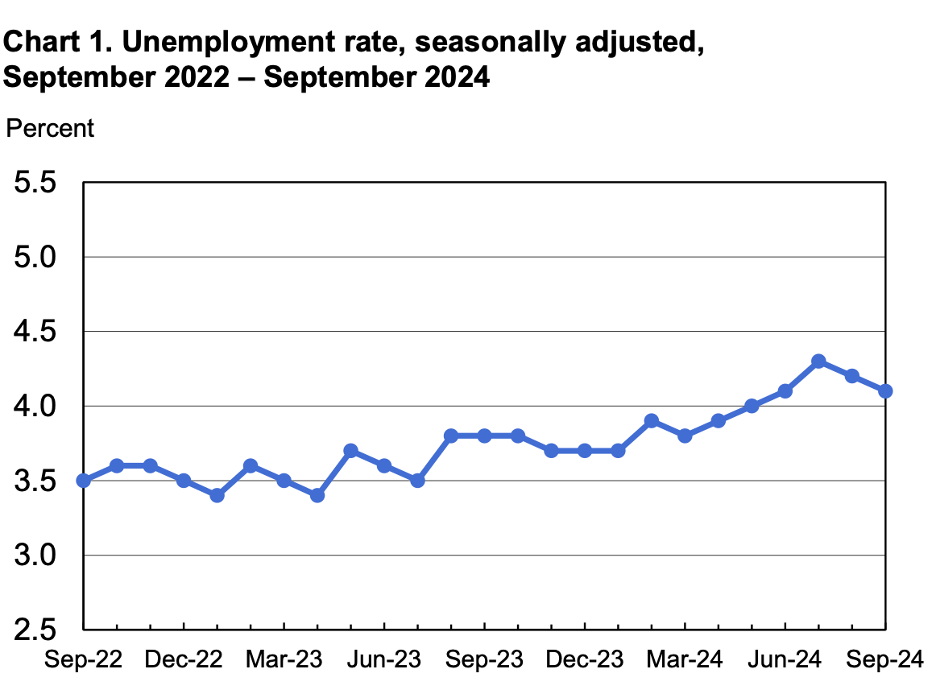
The news on the labor market has also been upbeat. The unemployment rate, shown below, dropped in September for the second consecutive month. At 4.1 percent, it is likely a shade below the rate that is widely regarded as the sustainable rate.
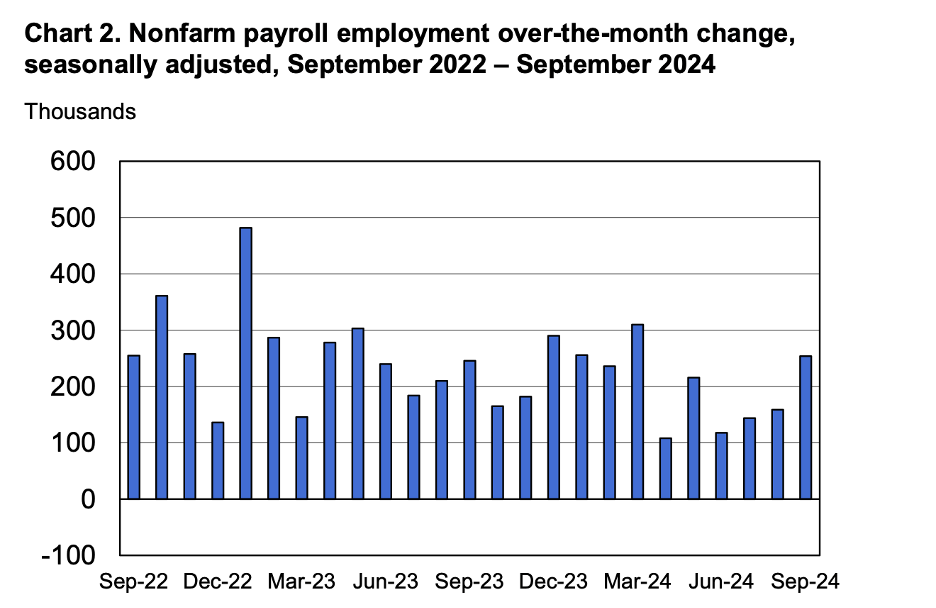
Meanwhile, employment growth perked up to more than 250 thousand last month (the next chart), far exceeding analyst expectations and increases that are believed to be associated with the absorption of new entrants into the labor force. Notable among the sectors experiencing large increases in employment was the private service sector, which added 200 thousand workers, a substantial pickup from previous months.
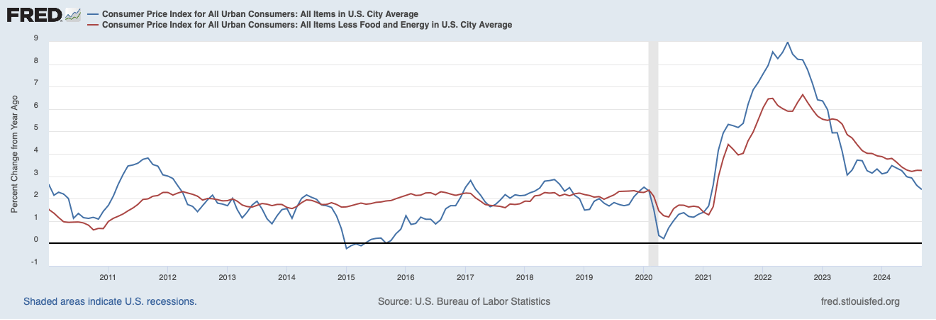
Turning to inflation, recent data suggest that the return to price stability will likely be more challenging than expected by the Fed and market participants. The headline CPI rose only 0.2 percent in September and the twelve-month change fell to 2.4 percent from 2.6 percent in August (the blue line in the chart below). However, core CPI inflation, which excludes volatile food and energy prices, is more representative of underlying inflationary pressures (the red line) flattened out in September at 3.3 percent.
It is useful to break out the commodities component of core inflation from the services component to better assess whether some temporary factors may be slowing the disinflation process. The following chart shows the twelve-month change in core commodity prices (the blue line) and core service prices (the red line). Commodity prices were buffeted by COVID-related supply chain bottlenecks which led to a surge in commodity prices in 2021 that was followed by price declines as supply chain pressures unwound. Commodity prices began declining in May 2023 but turned up last month, and the twelve-month decline moderated in September to -1.2 percent. Looking ahead, the drag on core inflation that has come from the return to more normal supply-chain pressures has come to an end. Going forward, it is unclear whether commodity prices will return to being largely flat, as they were during the low inflation period before the pandemic, or whether they may be increasing in keeping with other prices.
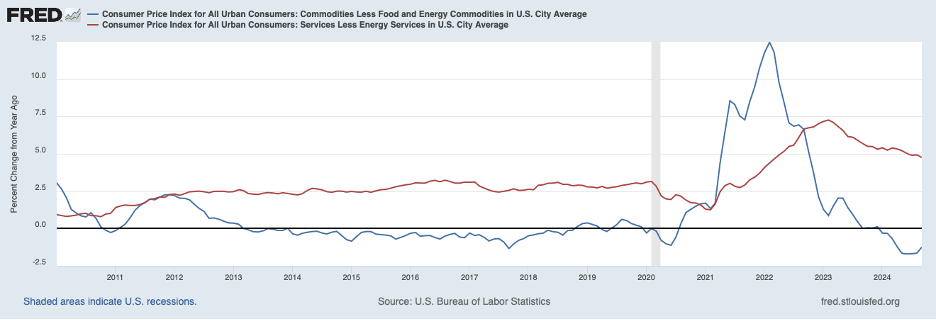
Core service prices rose 0.4 percent in September, matching the swollen monthly increases earlier in the year. As a result, the twelve-month increase in service prices stayed at nearly 5 percent. This twelve-month increase is roughly 2 percentage points above the pre-pandemic period.
Further insight into inflationary pressures can be gleaned by breaking down service price inflation into the rent of shelter and prices of other services. Service prices constitute about 60 percent of the CPI, and rent accounts for roughly 60 percent of service prices. The next chart shows twelve-month increases in rent of shelter (the blue line) and other service prices (the red line). Increases in rent of shelter have dropped from a peak of more than 8 percent in early 2023 to 5 percent in September and other information on new leases points to possibly more slowing in the months ahead. To a degree, outsized immigration has been putting upward pressure on housing costs in recent years, and the outlook for this important component of consumer prices depends on the outlook for immigration.
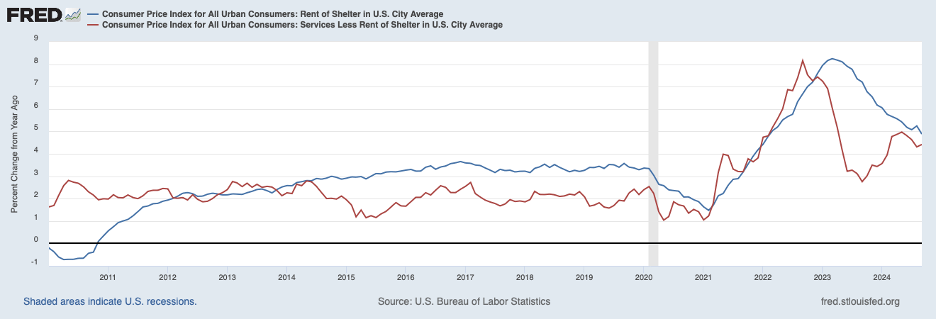
The increase in other service prices also reached a peak of more than 8 percent and has fallen appreciably since then. However, other service prices increased 0.6 percent in September, the largest monthly increase since early this year. This lifted the twelve-month increase to 4.4 percent, which is more than 2 percentage points above the pre-pandemic pace.
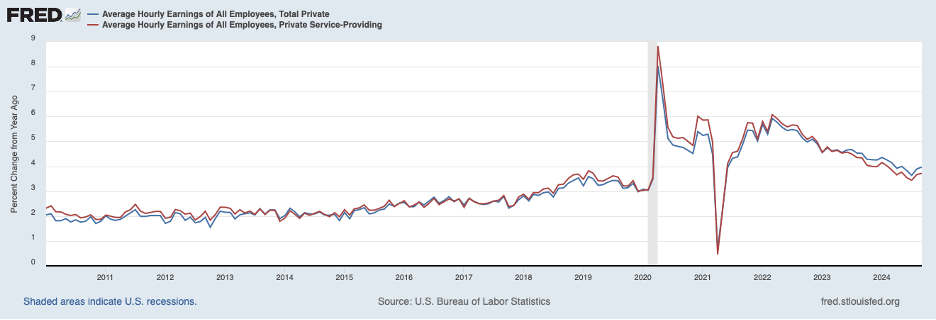
A key contributor to service prices is labor costs in the service sector. Shown next are twelve-month increases in average hourly earnings for private service workers (the red line) and for all employees in the private sector (the blue line). Wage growth reached a recent peak in early 2022 of approximately 6 percent for both groups and then slowed until recent months when wage growth has leveled off. Recent wage increases have been roughly one percentage point above the pre-pandemic rate as the labor market remains strong, especially the private service sector.
Something that will require care over the coming final months of this year is the interpretation of incoming consumer price data. Seasonal adjustment of price data may be distorting patterns around year-end, understating inflation in the last few months of the year and overstating inflation in the first few months of the following year. The table below presents annualized headline and core inflation rates over three recent four-month periods.
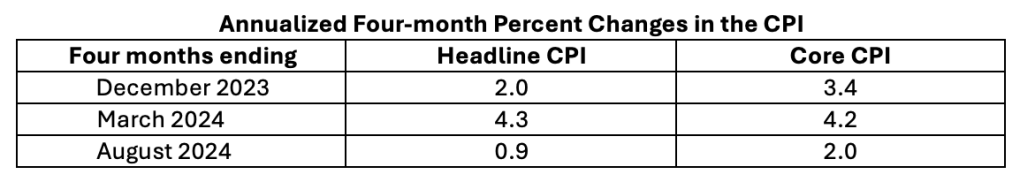
Both headline and core CPI inflation were relatively low in the final four months of 2023 and then picked up smartly in the first four months of 2024. Many observers around year-end 2023 came to believe that inflation was on a distinct downward trajectory and that the Fed could start to ease policy in the early part of 2024. However, those observers were surprised by an apparent resurgence over the early months of 2024. If the seasonal adjustment difficulties of consumer price data have indeed been obscuring intra-yearly patterns, then the price news over the next few months may be understating inflation trends.
The Fed described the surprise 50 basis point cut in its target for the federal funds rate in mid-September as a “recalibration.” Since the last increase in the federal funds rate in late July 2023, underlying inflation has fallen, which increased the real federal funds rate. The Fed acted to offset some of that restraint. Below is a measure of the real federal funds rate—the effective federal funds rate less the twelve-month change in core inflation (using the Fed’s preferred PCE index)—through August. This measure of the real federal funds rate rose roughly one percentage point after the final rate hike in July 2023 to around 3 percent, and the September move was intended to apply less restraint, especially in view of what were thought to be favorable inflation trends.
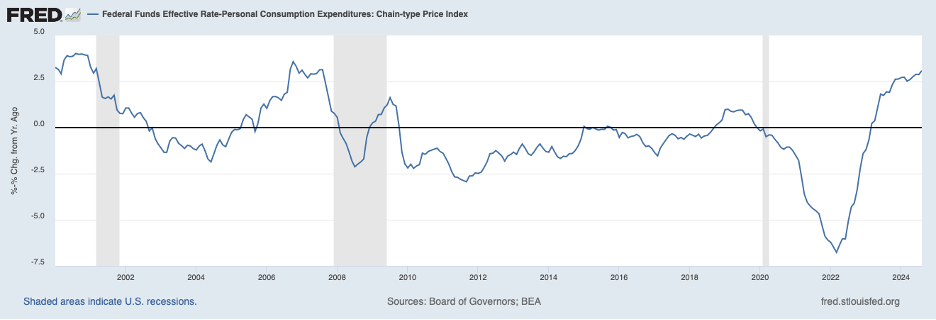
The current level of the real federal funds rate—now in the vicinity of 2-1/2 percent—is likely in restrictive territory. But how restrictive is an open question. Fed policymakers tend to believe that the neutral level of the real federal funds rate—the rate at which policy is neither restrictive nor accommodative—is about one percent. However, there are reasons to believe that the neutral rate may have been moving upward and is above 1 percent. If so, the degree of restraint may be smaller than many believe. Moreover, the discussion of the recent news on inflation above suggests that policy needs to remain restrictive to restore price stability. The current situation calls for considerable patience in contemplating additional interest rate cuts.
Featured Image: 500Photos/Pexels
