
In mid-December, the Fed cut its policy interest rate by 25 basis points and conveyed that it likely would be taking a pause from further rate cuts. Nonetheless, Chair Powell and other Fed officials have said that they believe the Fed’s policy remains restrictive, holding down economic growth and inflation.
The evidence since that time has been mounting that the U.S. economy ended 2024 on a strong note, raising questions about the degree of restraint coming from monetary policy. The momentum in growth of real GDP continued through the fourth quarter, which now appears to have stayed around a brisk 3 percent rate. One indicator of the resilience of the economy is the housing sector. Shown below are permits for single-family homes through the end of 2024. The chart shows that housing activity has been buoyant over recent months, running above the pre-pandemic rate, even though mortgage rates are nearly three percentage points higher than on the eve of the pandemic.
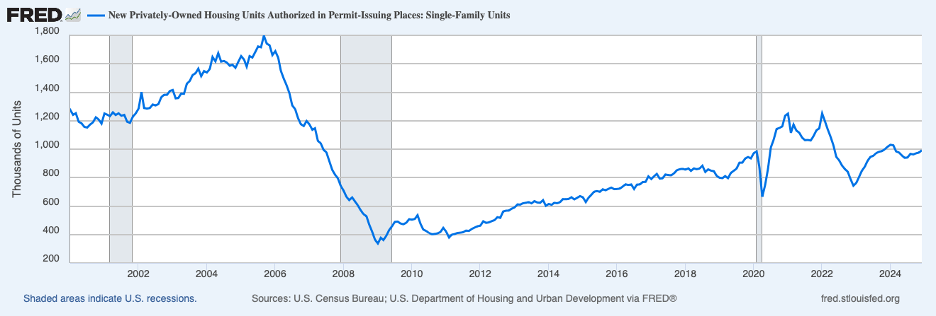
This buoyancy in the face of the highest mortgage interest rates in more than two decades has surprised many analysts.
Strength has also been evident in the labor market, which showed few signs of cooling recently, as evidenced by the employment report for December showing stellar employment gains of 256 thousand. Below is the ratio of job openings to the number of unemployed persons through November (most recent data).
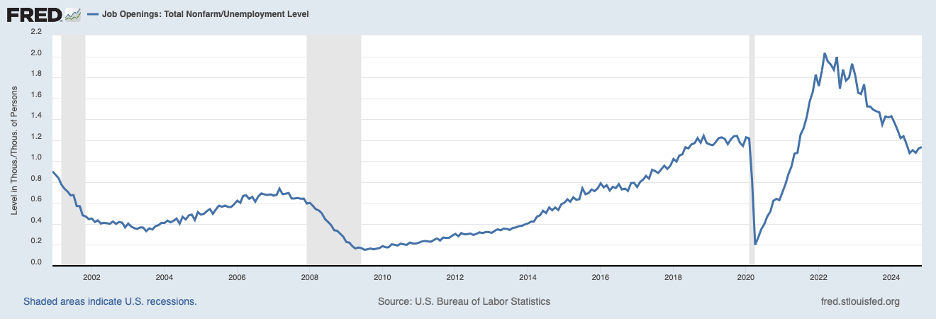
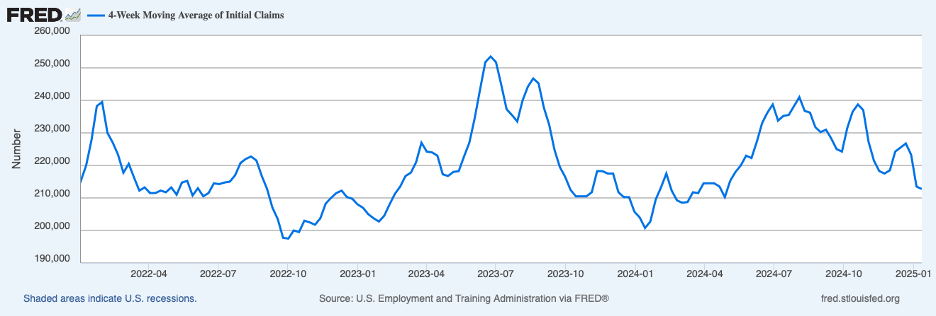
This ratio stopped declining in September 2024 and, since that time, has edged up. There continue to be more job openings than people who are unemployed, which likely persisted through December. Moreover, initial claims for unemployment insurance on a four-week average basis (which smooths out week-to-week volatility), the next chart, have been on an overall downward trajectory since mid-2024.
Turning to inflation, core CPI inflation ticked down to 3.2 percent on a twelve-month basis in December (shown by the broken green line in the chart below), even as an upturn in energy prices dragged headline inflation higher (the blue line). Core inflation over the twelve months ending in December 2024 was down from 3.9 percent over the comparable period in 2023.
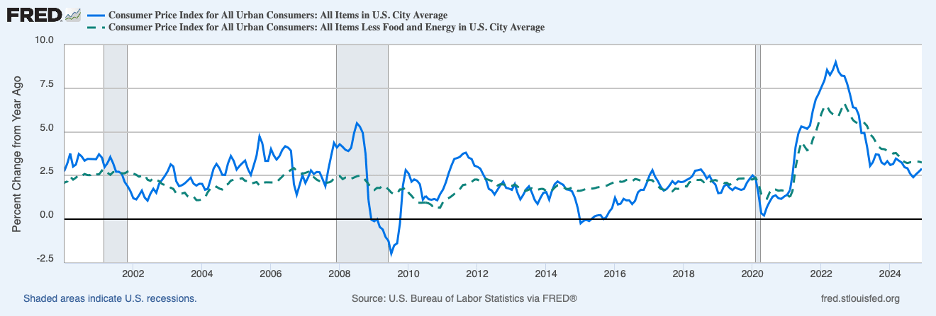
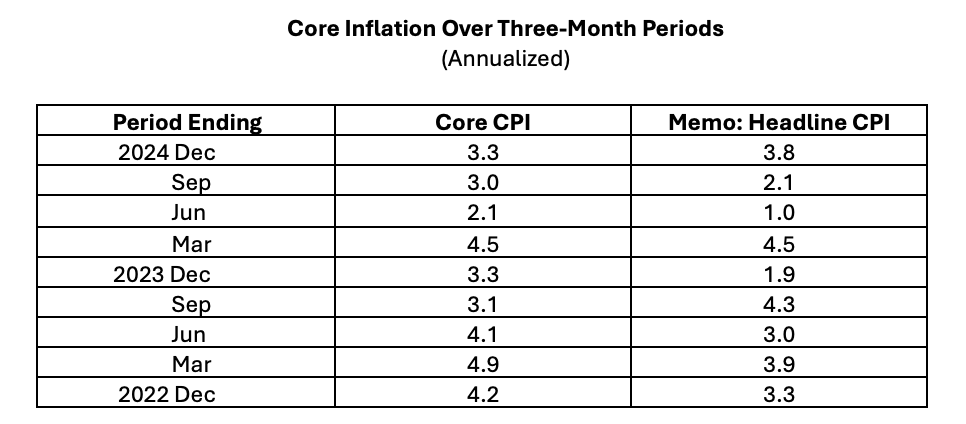
Can we conclude that core inflation continued to fall over 2024? The table below, showing three-month changes in core CPI inflation (annualized), addresses this question. Over the periods ending in March, June, and September 2024, there was lower core CPI inflation than in the counterpart periods in 2023. However, core CPI inflation for the three months ending in December 2024 was unchanged from a year earlier, at 3.3 percent, suggesting that the disinflation process may have stalled.
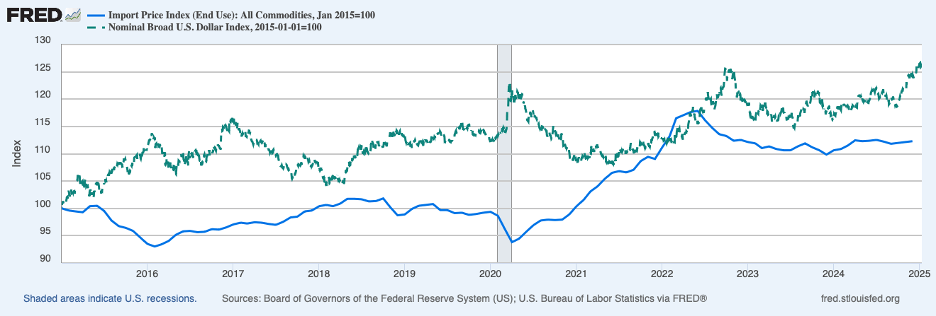
It is likely that recent strength in the dollar has been holding down consumer price inflation, especially goods price inflation. The chart below shows an index of the exchange value of the dollar (the broken green line) and an index of the level of import prices (the blue line). These two series typically move in opposite directions—when the dollar strengthens, import prices fall or level off. The exception was in 2021 and 2022, when supply chain disruptions led to a surge in import prices even as the dollar began to strengthen in mid-2021. Since late last September, the dollar has risen more than 7 percent, which likely has begun to and will continue to limit goods price inflation in coming months.
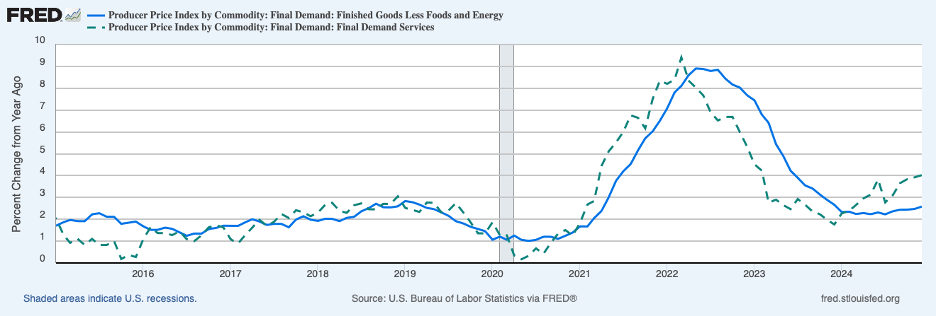
Despite downward pressure coming from the dollar, goods prices have been on the upswing over recent months. The blue line in the chart below shows twelve-month increases in the Producer Price Index for core goods (finished goods less food and energy). This measure has been edging up since mid-year and has been running above the pre-COVID pace in recent months. Moreover, the increase in PPI service prices has been on a general upward trend for the past year and also has been running above the pre-COVID pace. (A broadly similar story is found in the CPI data over recent months.)
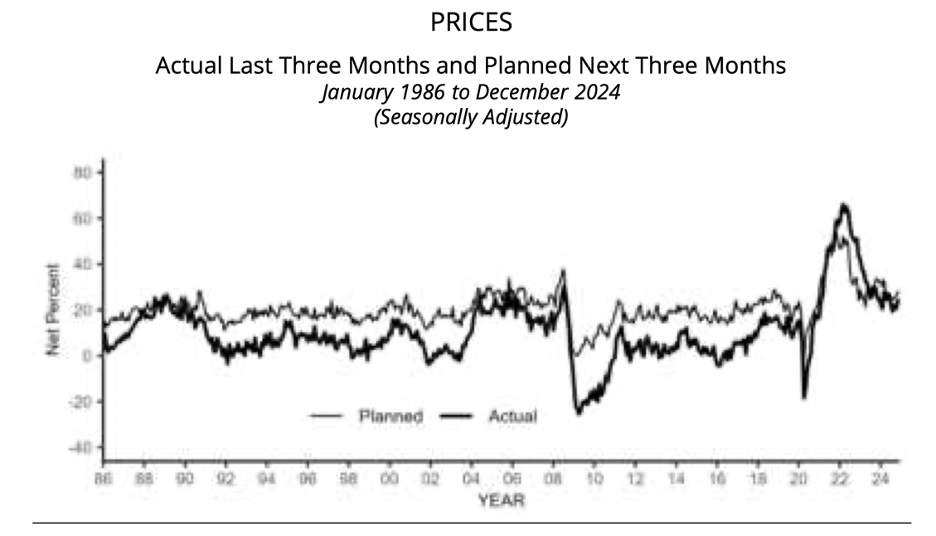
Stubborn inflation pressures are further suggested by the most recent survey of small businesses by the National Federation of Independent Business (NFIB). The thinner line in the chart below shows that the proportion of respondents who plan to raise their prices in the coming three months has been ticking up over recent months and remains above the range that prevailed over the decade prior to the pandemic.
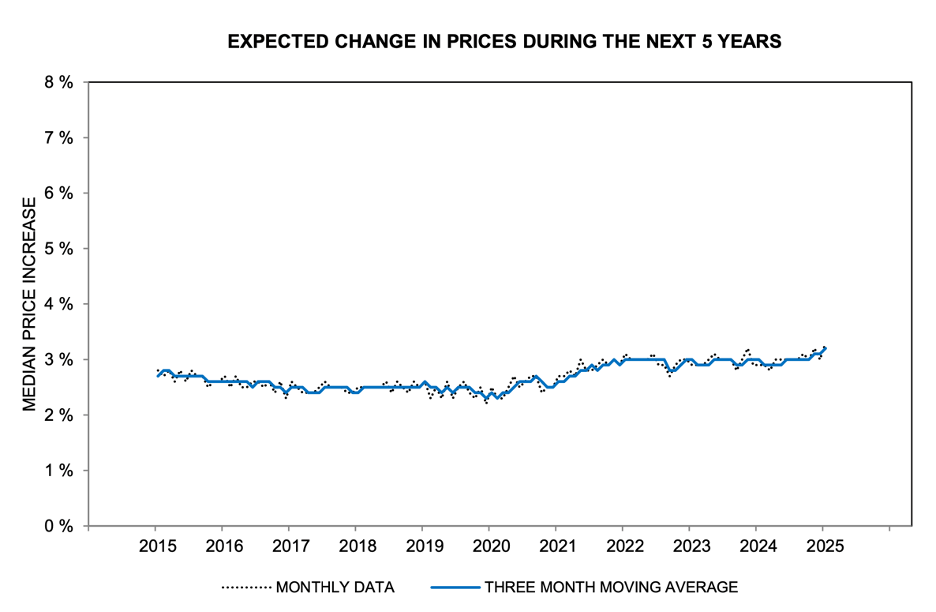
Inflation expectations may also be edging higher. Consumer expectations of inflation over the next five years from the Michigan survey are shown in the next chart. These expectations have been tilting upward over recent months, moving further away from the pre-COVID period, and perhaps are suggesting that consumers are seeing inflation to be more entrenched than previously.
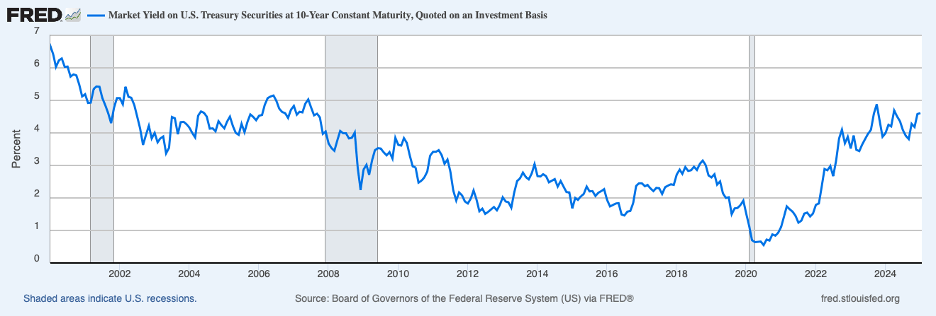
One can conclude that the recent news on the economy and inflation suggests that monetary policy has not been restrictive enough to restore price stability. If so, longer-term benchmark interest rates, such as the yield on the ten-year Treasury note, will need to rise further. The next chart shows that the yield on the ten-year note has risen nearly 25 basis points since the Fed in mid-December conveyed that it was not going to be in a hurry to cut its policy interest rate again.
The following chart shows the expected path of market participants for the policy rate over the next couple of years. The lines represent the path the day before the December policy announcement (the blue line) and a recent date (the green line).
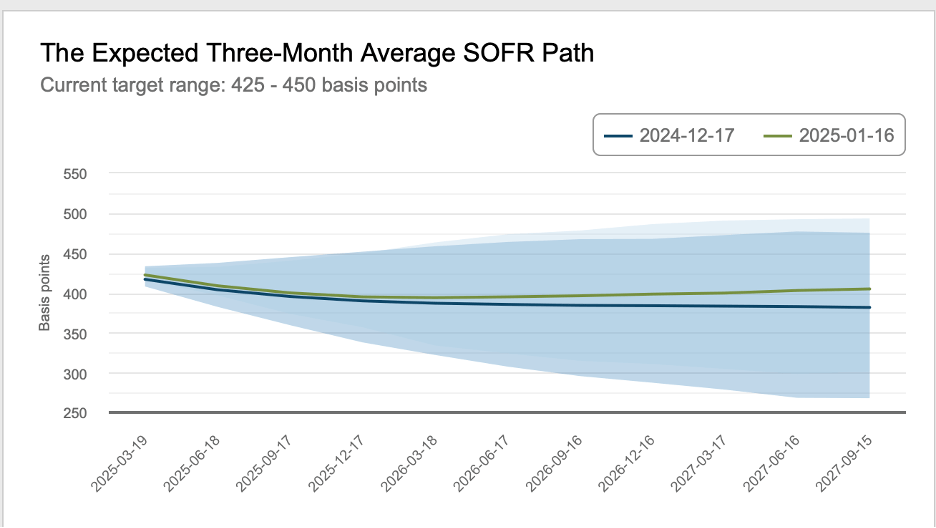
The chart shows that market participants now expect a shallower path of rate reductions in the period ahead than in mid-December which has contributed importantly to the recent backup in the ten-year benchmark rate. However, the higher benchmark rate is likely insufficient to curb the persistent inflationary pressures that the recent news examined above points toward. Coupled with prospective higher prices coming from tariffs and more fiscal stimulus, a reasonable conclusion is that the next move by the Fed will more likely need to be upward than downward.
Featured Image: Joey Kyber/Unsplash
