
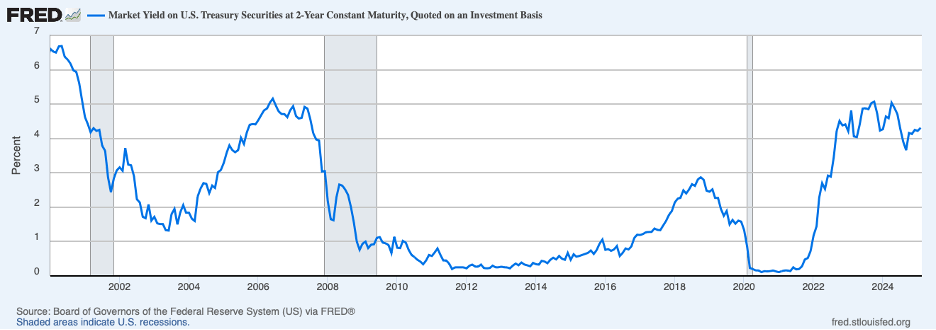
The Fed announced in late January that it was standing pat on its target for the federal funds rate, following three consecutive rate cuts amounting to 100 basis points. The chart below shows the yield on the two-year Treasury note which can be thought of as expectations of market participants of the average federal funds rate over the next two years. This rate, near 4.3 percent, is down 50 basis points since midyear 2024. However, despite somewhat disappointing inflation news, it has remained unchanged since the last rate cut in December.
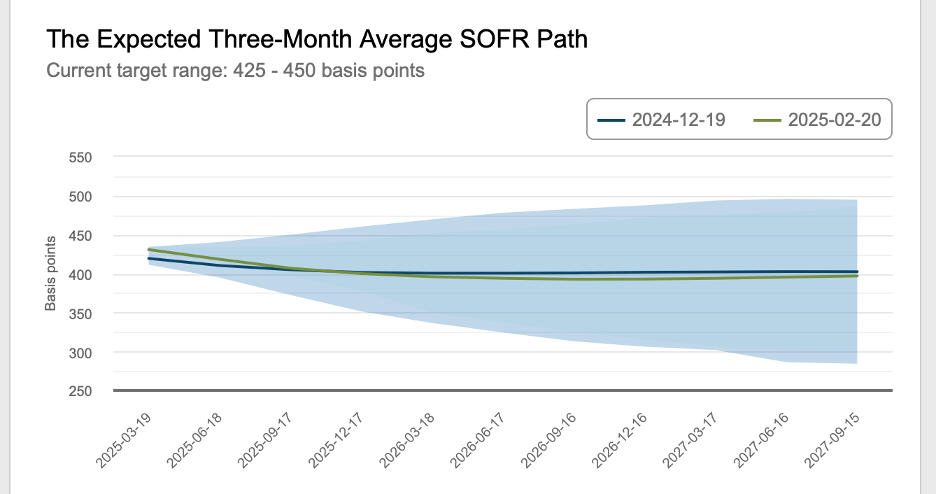
Broadly consistent with no change in the yield on the two-year note are expectations for the path of the secured overnight financing rate (SOFR) over the next few years—which tracks closely expectations for the Fed’s policy interest rate—and is little changed since the FOMC meeting in December. The green line shows the expected path on a recent date and is almost indistinguishable from the blue line, the expected path right after the Fed’s announcement in on December 18. (At both times, market participants envisioned a small rate cut by the end of 2025.)
Key to where the Fed’s policy rate is headed is the course underlying inflation and whether it will resume moving downward toward the Fed’s 2 percent target. The January CPI release has clues about the direction of underlying inflation. The next chart shows that on a twelve-month basis, both the headline (the solid blue line) and core CPI (excluding volatile food and energy prices, the dotted line) ticked up to 3.0 and 3.3 percent, respectively, in January—staying well above the pre-pandemic period of subdued inflation.

To gain a better bead on underlying inflation trends, the table below shows (annualized) core inflation over three-month periods ending in the month specified. There has been some concern by analysts that consumer price data that are adjusted for seasonal variations (which are the focus of attention here and elsewhere) may still have some residual seasonality embedded in them, perhaps adding to difficulties in discerning recent trends. Another concern by some observers is that inflation readings may be overstating underlying inflation by including some items (particularly certain financial services) that are imputed instead of being based on actual transaction prices. Comparing three-month periods ending in the same month in adjacent years should give better insight into recent trends. (Note that the release of January CPI data also included updated seasonal adjustment factors, which should have reduced any residual seasonality.)
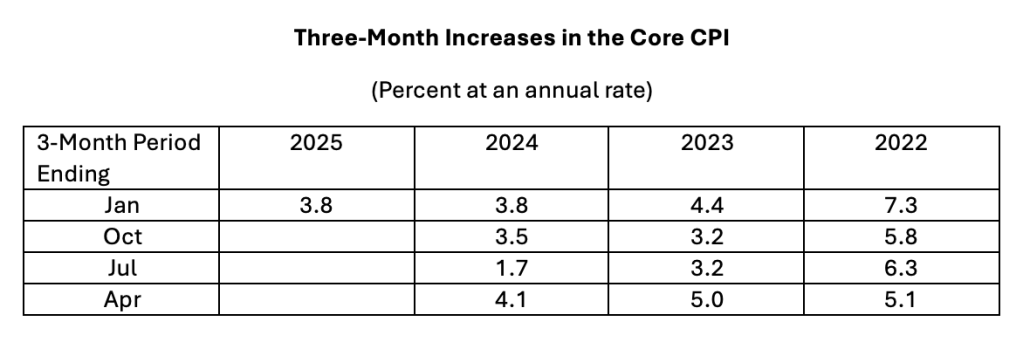
For the three-month period ending in January, there was a slowing in 2023 and 2024 but no slowing in 2025. The inflation rate for the three-month period ending in January 2025 was the same as in the comparable period ending in 2024, 3.8 percent (and well above the twelve-month rate). Thus, it’s hard to find evidence of further disinflation in the core and headline CPI data.
We can look under the hood of the CPI data and examine the principal components of the CPI to see if they provide some further insight on underlying inflation. The chart below presents increases in the CPI for core commodities (dotted blue line), the CPI for rent of shelter (the broken red line), and the CPI for services other than rent of shelter (the solid blue line). Both inflation in rent of shelter and services other than rent of shelter slowed further in January but remained well above the pre-pandemic period.
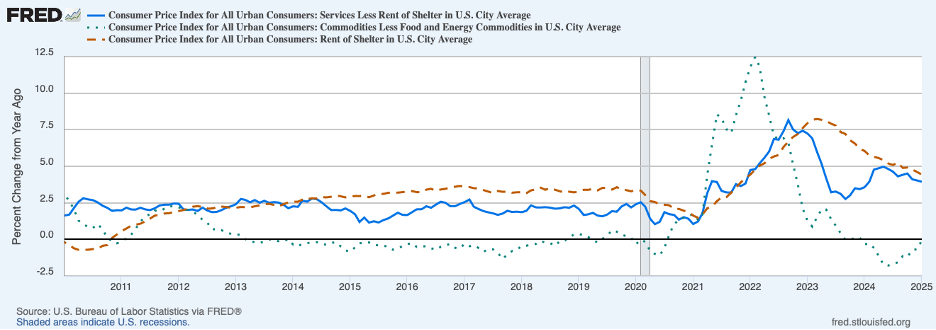
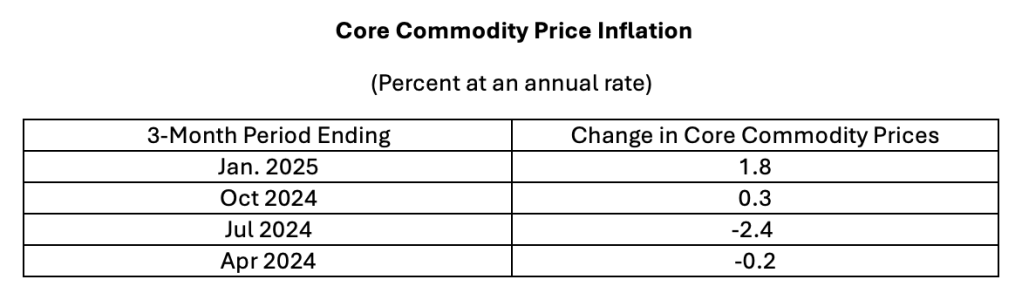
After wild swings in recent years owing to supply-chain disruptions, the twelve-month change in core commodity prices was essentially zero in January, comparable to the pre-pandemic period. However, the twelve-month change appears to be masking an upward trend in core commodity price inflation. The next table shows (annualized) core commodity inflation over recent three-month periods. Core commodity prices rose at an annual 1.8 percent over the three months ending in January after being essentially flat over the previous three-month period. This evidence could suggest that core commodity prices may be settling into increases that will exceed the pre-COVID period.
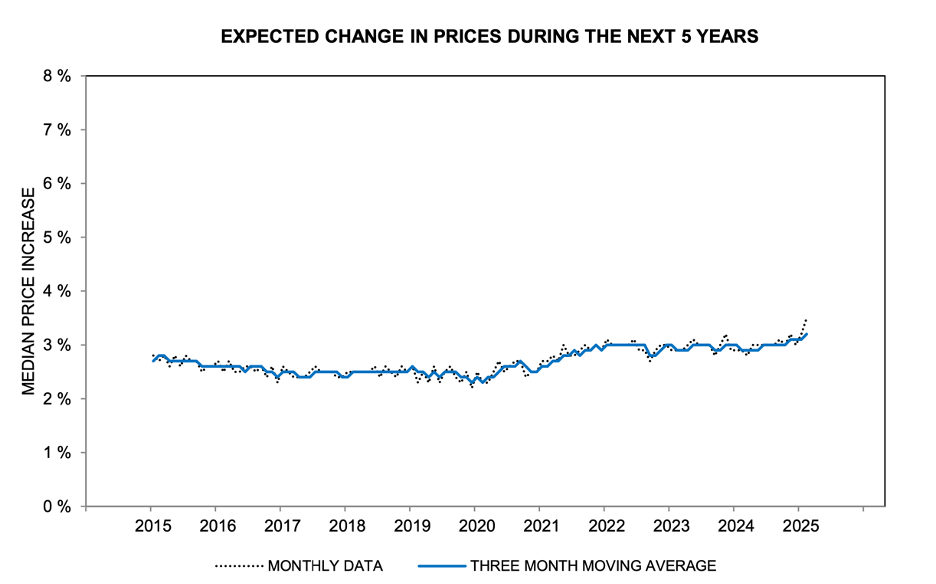
Thus, the January CPI data are casting doubt on whether core inflation is slowing and moving toward the Fed’s 2 percent target. Moreover, consumer survey data from the Michigan survey of consumer attitudes suggests that expectations of inflation over the next five years have been drifting upward recently, as shown in the chart below. If inflation expectations are indeed increasing, higher inflation expectations will make it even harder for the Fed to get back to price stability.
The above discussion may suggest that there is not sufficient monetary restraint coming from the Fed to bring inflation lower. The chart below shows that the real federal funds rate (the federal funds rate adjusted for underlying inflation) was a little above 1-1/2 percent at year-end 2024, down from 2-1/2 percent before the mid-September 2024 rate cut. Of importance is the relationship between the real federal funds rate and the neutral rate (the level of the real federal funds rate at which monetary policy is neither stimulative nor restrictive). The neutral rate is not observable directly and must be estimated. Many estimates suggest that the neutral rate had been on the order of 2-1/2 percent for some time prior to the financial crisis in 2008. The neutral rate is estimated to have subsequently fallen precipitously to around 1 percent before retracing some of that post-2008 decline.

Economic principles bearing on the neutral rate raise some doubt about whether the underlying neutral rate could have moved so much over a relatively short swath of history and whether something else may have affected the estimates. If the underlying neutral rate currently is near its longer-term level of 2-1/2 percent, then the conclusion is that monetary policy is not restrictive at all and instead is stimulative—which will not bring inflation lower and toward the Fed’s target. Moreover, even if the neutral rate is only 1 percent, monetary policy would be barely restrictive at a time when inflation appears to be stubbornly entrenched above the Fed’s target.
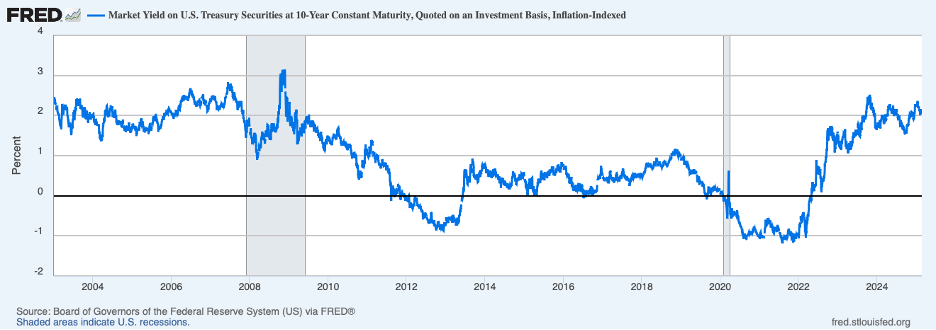
Working to help the Fed achieve its price stability goal are longer-term interest rates, shown below by the yield on the ten-year inflation-indexed (TIPS) Treasury note. This measure of the real long-term interest rate has returned to its level of the spring of 2024, despite cuts by the Fed in its target interest rate of 100 basis points since mid-September. Nonetheless, this yield is not outside the experience of the past quarter century, which, until recent years, was characterized by subdued inflation.
With an economy that still has forward momentum and a labor market that remains quite strong, if the Fed is serious about restoring price stability, its next move could well be upward.
Header Image: Alessia Cocconi/Unsplash
