
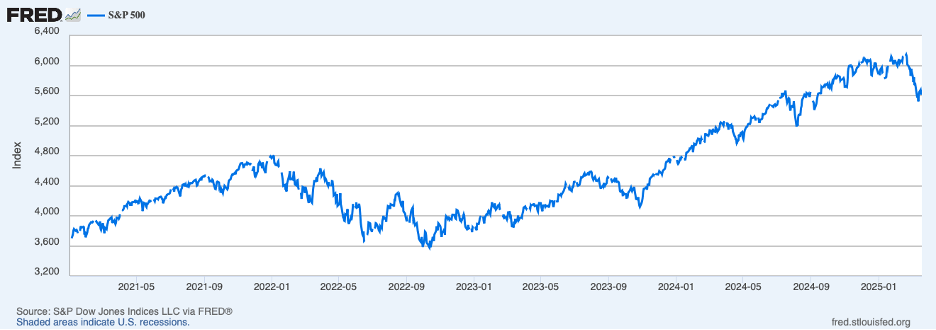
With investors’ nerves fraying, there has been a sell-off in the stock market and a flight to safety in Treasury securities. The chart below shows that the S&P 500 index of share prices has fallen 3-1/2 percent from the end of 2024, erasing $1.3 trillion of household wealth.
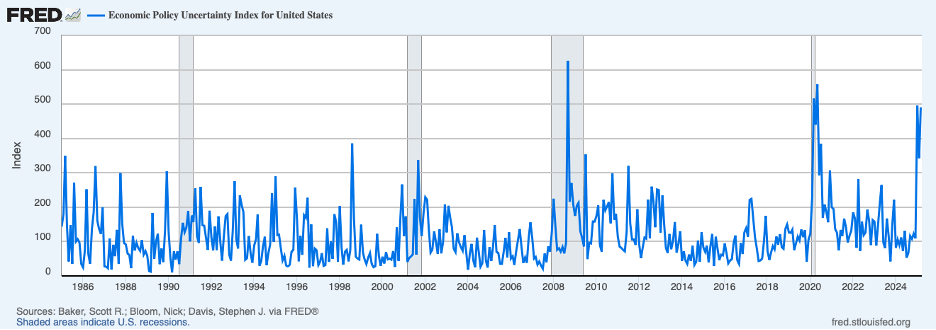
Market analysts have attributed the turmoil in markets to new economic policies, notably tariff wars and precipitous federal spending cuts, contributing to greater uncertainty about the outlook for the economy and inflation. The next chart shows an index of economic policy uncertainty, which has spiked recently to levels that rivaled the 2008 financial crisis and the 2020 pandemic.
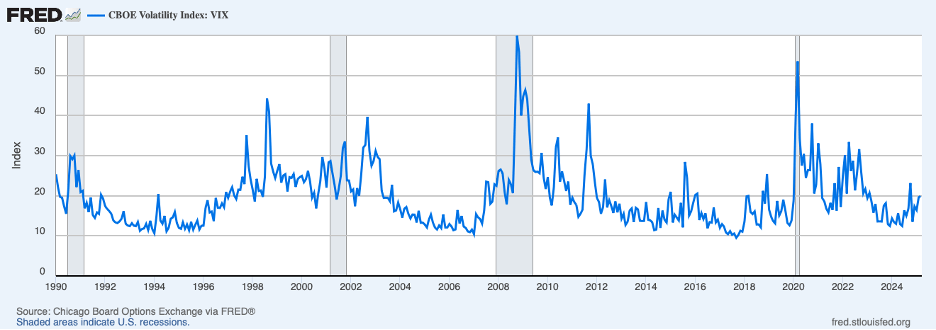
The spike in uncertainty has led to a sharp increase in prospective stock price volatility, shown next by the volatility index of S&P 500 share prices derived from the prices of options on the S&P 500. Increases in prospective share price volatility cause investors to seek compensation for the greater risk by paying less for shares.
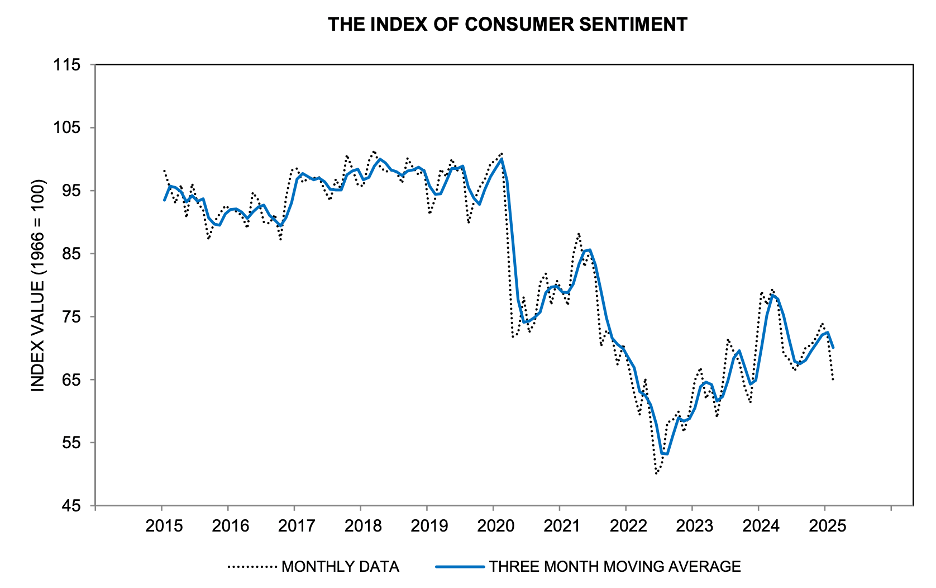
Meanwhile, consumers have become less confident about the outlook, and the Michigan survey of consumer sentiment has deteriorated markedly recently, as shown by the dotted line in the next chart. This deterioration, along with the loss of wealth from the stock market, has heightened worries about an impending recession. (The loss of wealth from lower stock prices, by itself, will tend to reduce consumption and real GDP by only 0.3 and 0.2 percent, respectively.)
The tariff war can be expected to boost consumer price inflation, at least for a while, and curb consumer and business spending, thereby limiting growth in output and employment. These effects become more pronounced when other jurisdictions retaliate, which has been the case. The tariff war poses vexing choices for the Fed, which has been attempting to restore price stability while keeping a close eye on the labor market to prevent slack from developing in that market. Since late last summer, the Fed has been inclined to lower its policy rate to keep the labor market from softening while expressing confidence that further deceleration in consumer prices was in the works.
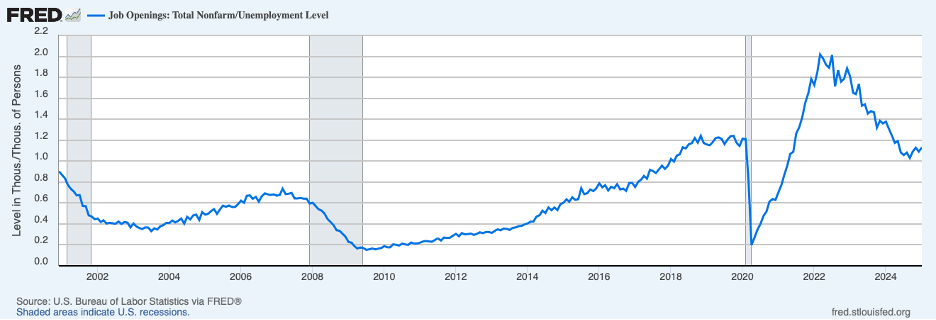
At present, the labor market appears to have remained strong. The next chart shows the ratio of job openings to the number of unemployed through January (the most recent data on job openings). This ratio has leveled off at a little more than one job opening for each person unemployed and remains high by historical standards.
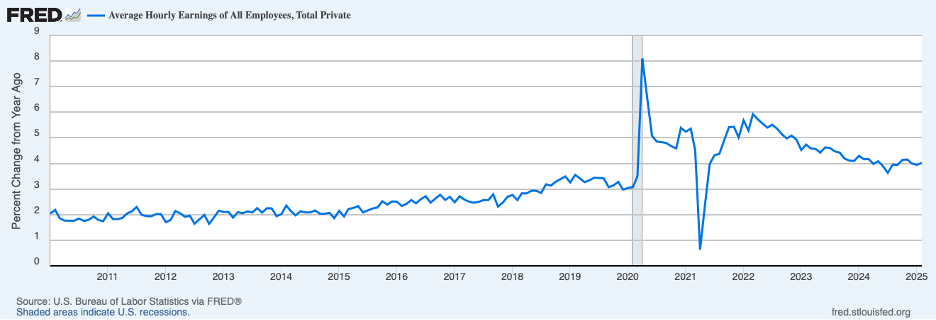
Consistent with a continuing strong job market are twelve-month increases in average hourly earnings through February, the next chart. Average hourly earnings continued to increase at around the 4 percent rate, roughly one percentage point faster than during the pre-COVID period. (A portion of the faster increase in wages recently may be attributed to somewhat faster productivity gains; an increase in wage growth that matches an increase in productivity growth does not have inflationary implications.)
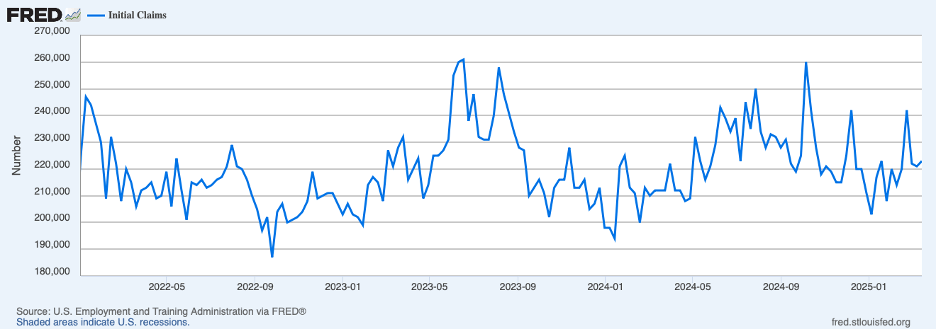
More recent evidence on the labor market is available from weekly initial claims for unemployment insurance, shown next. Cutting through the large week-to-week fluctuations, claims have stayed low through the second week of March, even as many federal employees have had their jobs terminated.
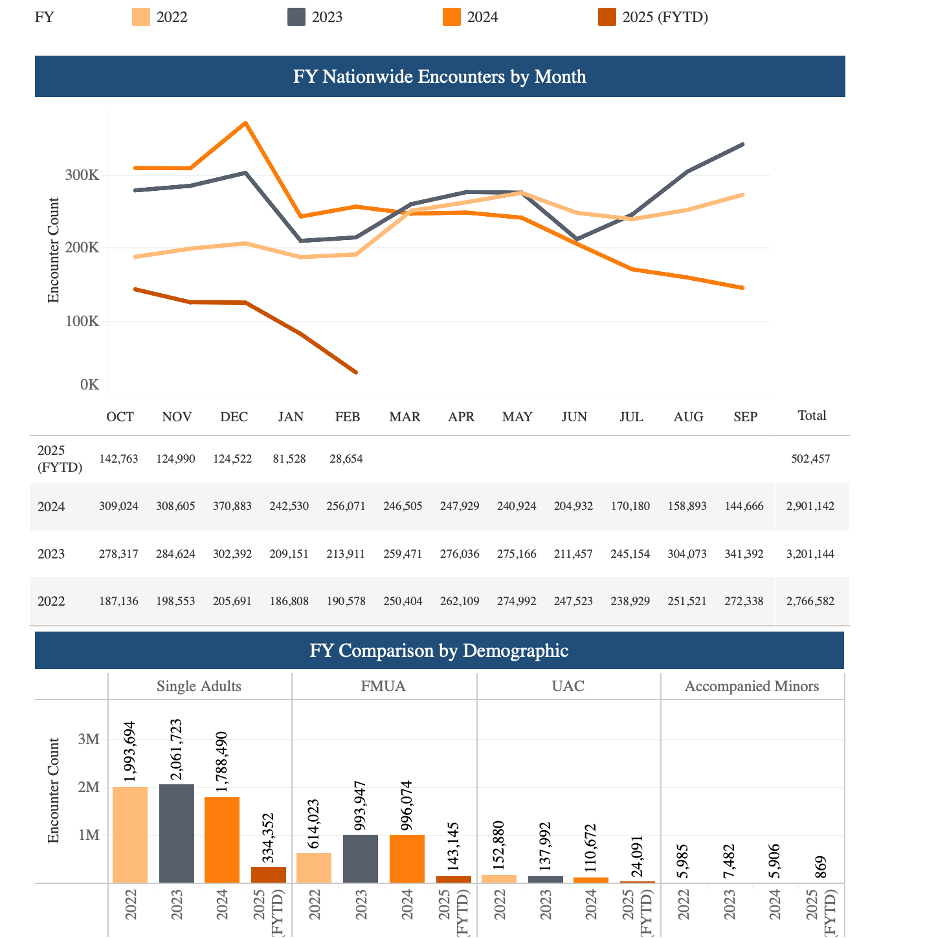
Going forward, there will be new difficulties in interpreting the employment data arising from the clampdown on border crossings. The chart below shows border encounters by U.S. Customs and Border Protection by month and (fiscal) year through February. In the years 2022 to 2024, border encounters tended to run between 200,000 to 300,000 per month until mid-2024, when they started to tail off. In January and February of 2025, they plunged.
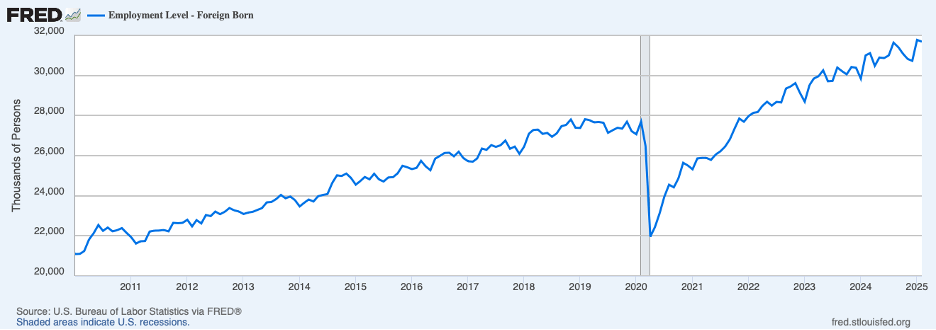
Shown next is the number of foreign-born workers taken from the monthly employment report. (These data come from the household survey and not the establishment survey that is most commonly used for measuring changes in employment. The household survey provides data on foreign-born workers.) Prior to the COVID-19 shock, the number of foreign-born workers was on a steady rise, increasing by 2.5 percent per year over the decade prior to 2020. Foreign-born workers accounted for more than one-fourth of the overall increase in employment over that period. In the years 2021 to 2023, the number of foreign-born workers surged, increasing nearly 6 percent per year and accounting for around 45 percent of the overall increase in employment. The number of foreign-born workers was leveling off over the second half of 2024, likely reflecting the slowdown in border encounters.
Looking ahead, growth in employment and output will be slowing in response to the sharp drop in immigration. Already in 2025, we have seen average monthly employment slow to 138 thousand from 168 thousand in 2024 and from 216 thousand in 2023. If monthly employment gains decline to 100 thousand from the average of roughly 250 thousand over the three previous years, growth in output will slow by at least one percentage point. (Growth in real GDP averaged around 3 percent annually over the 2021 to 2024 period, at a time when there was little overall slack in the economy, implying that growth going forward can be expected to be in the vicinity of 2 percent.) It will be increasingly difficult in the months ahead to discern whether the slowing in employment and output growth is coming mostly from the reduction in immigration (and reductions in federal employment) or from weaker consumer and business spending coming from other sources.
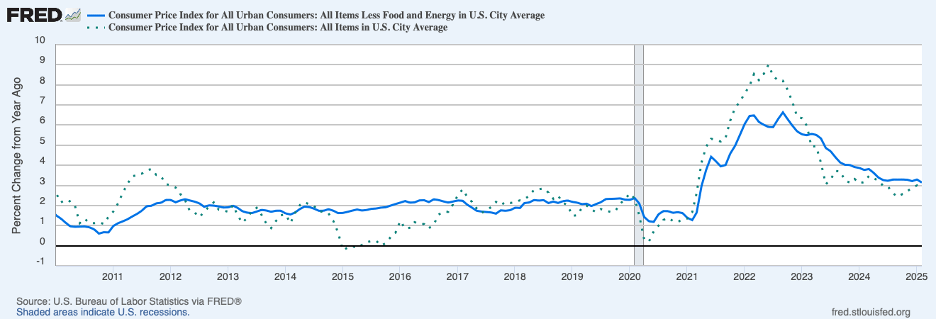
Turning to the news on inflation, markets greeted the release of the CPI for the month of February, which showed both headline and core inflation coming in below expectations at 0.2 percent. As shown in the next chart, the twelve-month increases in the headline CPI ticked lower to 2.8 percent in February and the core CPI to 3.1 percent. The core measure was down from 3.8 percent a year earlier.
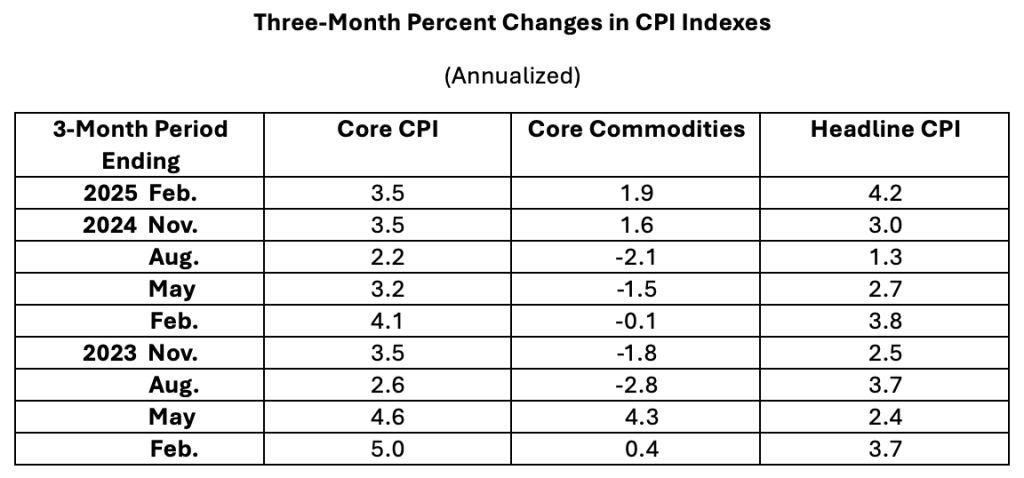
Changes in inflation trends can be slow to be revealed in twelve-month changes in consumer prices, and changes over shorter periods, such as over three-month intervals, will detect whether trends have changed sooner. The table below shows annualized three-month percent changes in the core CPI and two other CPI indexes. The core CPI rose at a 3.5 percent annual rate over the three months ending in February, above the rate over the twelve months ending in February. The three-month change for the period ending in February was the same as for the three-month period ending in November 2024.
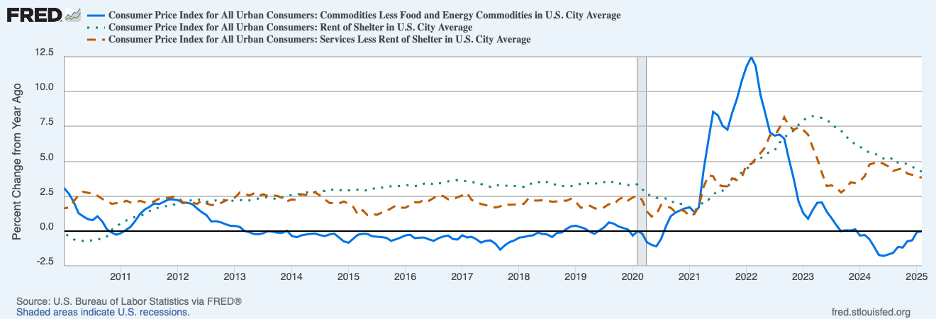
Breaking down the core CPI into its principal components can also be helpful in discerning inflation trends. The chart below shows twelve-month percent changes in core commodity prices (the blue line), rent of shelter (the dotted green line), and service prices other than rent of shelter (the broken red line). The twelve-month change in both rent and service prices continued to drift downward through February but remained above increases prior to the pandemic. In contrast, the twelve-month change in core commodity prices continued to move higher through February. Indeed, the table above shows that over three-month periods, core commodity prices accelerated through February. Whether the prospect of tariffs contributed to this acceleration in commodity prices remains to be seen.
Summarizing the news from the February CPI, it appears that the deceleration in consumer prices has stalled recently. Moreover, tariffs will be putting upward pressure on consumer prices in the months ahead, especially commodity prices. Whether tariffs will have a one-off or persistent effect on inflation will depend, importantly, on whether consumers and businesses come to expect more inflation.
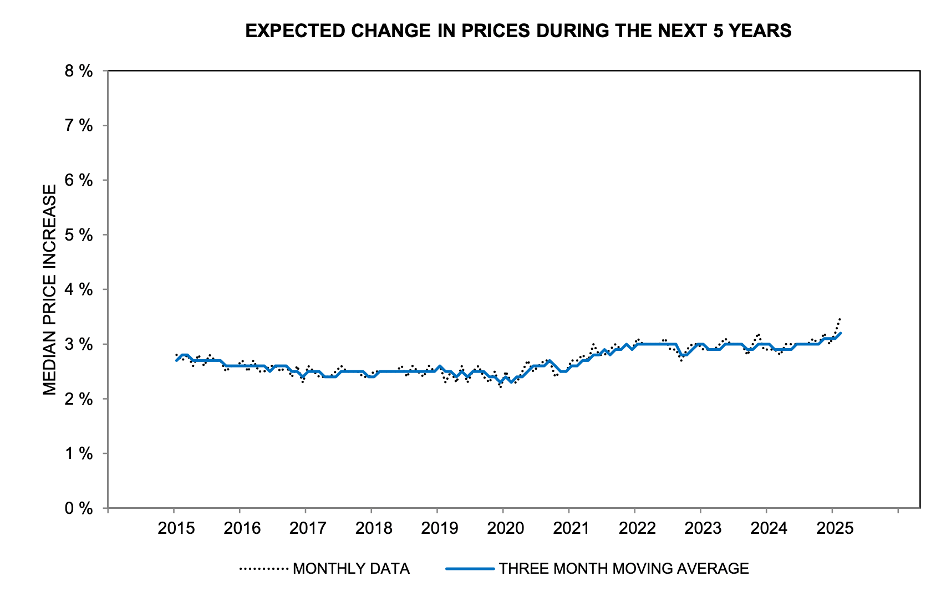
To date, the evidence on whether longer-run inflation expectations are being affected by recent developments has been somewhat mixed. The most recent Michigan survey of consumers, the next chart, shows a notable increase in expectations of inflation over the next five years.
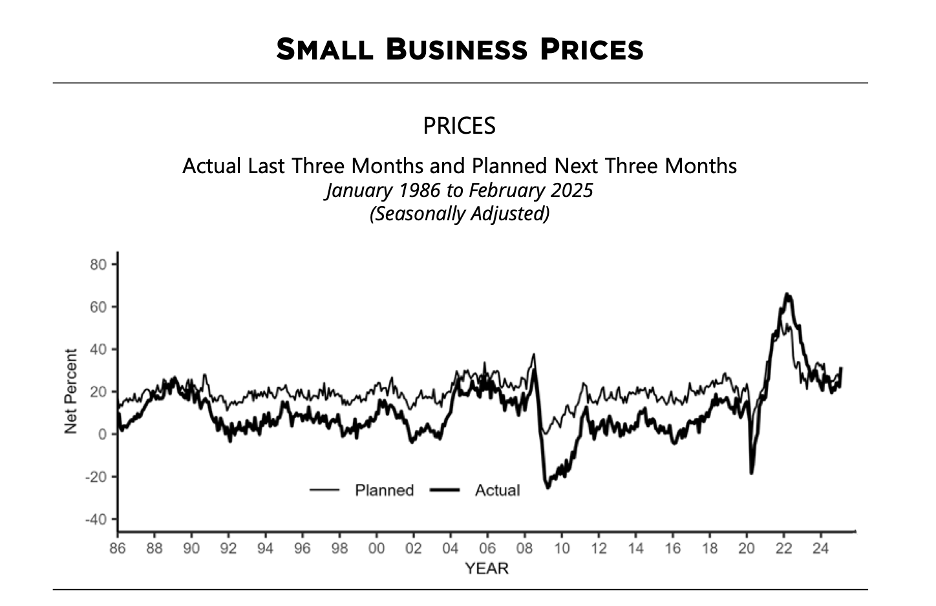
In addition, a larger share of small businesses in the most recent survey by the National Federation of Independent Business (NFIB), the next chart, reported that they increased prices over the past three months or planned to increase prices over the next three months.
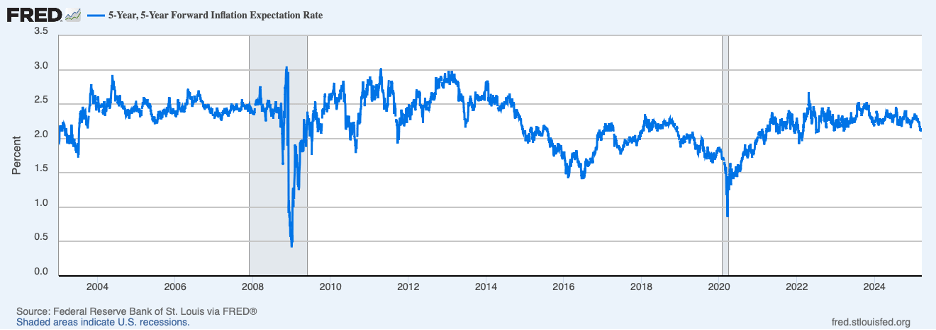
In contrast, measures of longer-term expectations of inflation derived from the market for Treasury securities imply no deterioration of inflation expectations on the part of market participants. The next chart shows implied expectations of inflation over the five-year period beginning in five years from the difference between nominal and inflation-protected (TIPS) yields on Treasury securities. While this measure has actually fallen a bit recently, it should be noted that when investors seek Treasury securities in a flight to safety as they have recently, they depress nominal yields more than TIPS yields, lowering this measure of inflation expectations.
The above discussion suggests that key data series on inflation, employment, and output are being affected by the sharp slowing in border crossings, federal firings, and tariffs. At a time when underlying inflation seems to no longer be declining, tariffs will be boosting consumer prices, especially commodity prices, making it more difficult to determine whether underlying inflation has been affected. In these circumstances, Fed policy can be expected to stay on hold for some time.
Header Image: Joshua Woroniecki/Unsplash
