
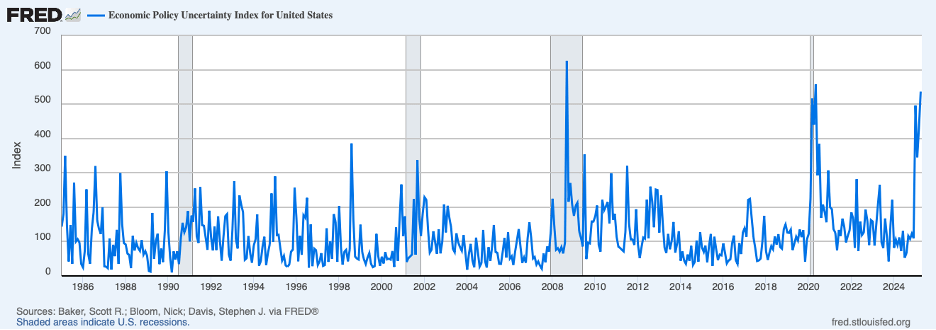
Uncertainty over economic policy has moved to levels reached during the financial crisis of 2008 and the COVID-19 shock of 2020. Policy uncertainty is shown in the chart below by the index of economic policy uncertainty. The principal driver of this surge in uncertainty has been the tariff war. More recently, though, the growing tension between the White House and the Fed has added to concern about the direction of economic policy.
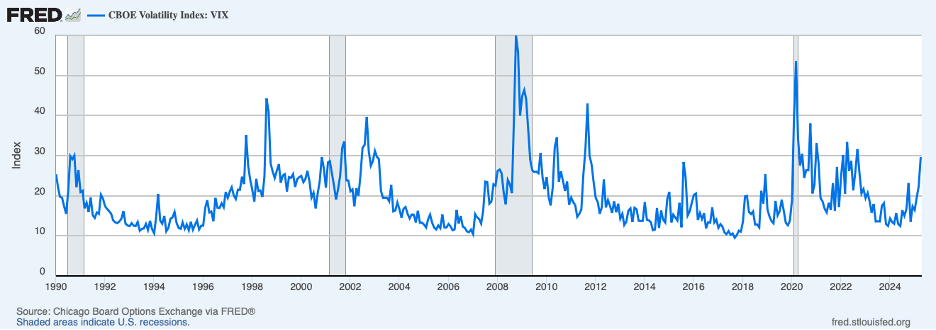
Policy uncertainty has been reflected in expectations of prospective stock price volatility as seen by the VIX index in the chart below. The VIX index, calculated using prices of options on the S&P 500, has risen to a historically high level, boosting the compensation for risk that investors require to hold stocks and depressing share prices. The S&P 500 index of share prices has fallen more than 15 percent from its peak in the latter part of February, erasing more than $5 trillion of consumer wealth.
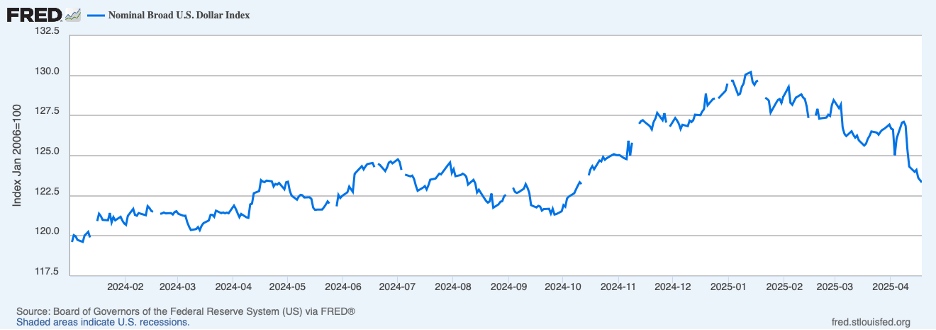
Typically, turmoil in the stock market is accompanied by a flight to safety by investors who seek the safety and liquidity of U.S. Treasury securities. And a shift into Treasury securities typically is accompanied by a stronger dollar on the foreign exchange market. However, since the tariff announcement on April 2, the dollar has fallen nearly 3 percent, shown in the chart below, with some of that drop coming once criticism of the Fed intensified.
Meanwhile, the yield on the Treasury benchmark ten-year note has risen about 25 basis points, the next chart, also moving counter to typical patterns in times of turmoil.

Furthermore, the price of gold spiked to a new record, shown by the next chart.

These movements in markets suggest that global investors are backing out of dollar investments amid a souring of investor sentiment toward the United States as a once-attractive place to invest.
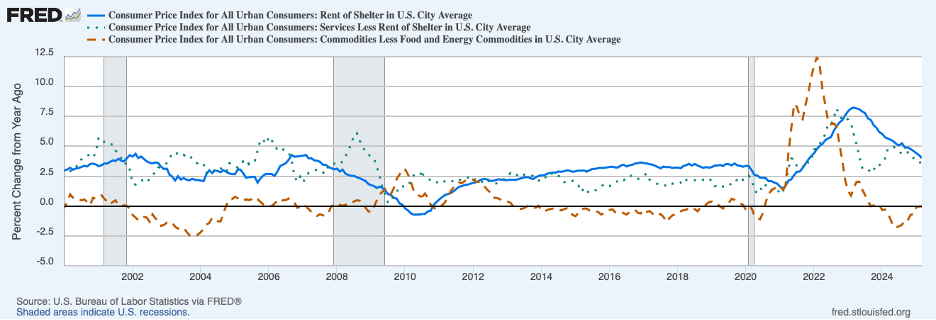
New tariffs and the weaker dollar will be adding to inflation pressures in the months ahead. The CPI release for March was generally seen as favorable. Core CPI inflation on a twelve-month basis, which appeared to have stalled since mid-2024, edged down in March to 2.8 percent, the blue line in the next chart, a full percentage point below a year earlier.
The moderation of inflation over the twelve months ending in March can be attributed to the services components of the CPI. The next chart shows that rent of shelter service price inflation, the solid blue line, and other service price inflation, the dotted blue line, both declined in March. In contrast, core commodity prices, the dashed red line, were unchanged on a twelve-month basis after more than a year of declines linked to an unwinding of supply-chain disruptions. Over the three months ending in March, however, core commodity prices rose at a 1.6 percent annual rate. It is difficult to determine whether some of the recent pickup in core commodity prices owed to prospective tariffs or whether upward momentum in these prices had been building apart from tariffs. In sum, the March CPI data can be viewed as generally good news, but monthly consumer price data are volatile. In normal times, it would take another month or two of favorable readings to confirm that underlying inflation had resumed drifting downward.
However, these are anything but normal times. The tariff shock, loss of wealth, and other uncertainties are likely to prompt a pullback in business and household spending. Indeed, forecasts of an impending recession have proliferated, although there is scant evidence that an economic downturn has already begun.
Currently, the Fed faces a serious policy dilemma. Inflation will be picking up while output and employment will be weakening as a result of the tariff shock. And it will be very difficult to determine whether all of the pickup in inflation owes to tariffs or whether some owes to underlying inflation. Economic principles suggest that if the central bank is satisfied with its policy stance at the time of the shock, it should maintain that policy stance. Lowering interest rates to counter weaker employment would risk more inflation, while raising rates to curb inflation would risk more unemployment.
However, inflation continues to run above the Fed’s 2 percent target, and it is conceivable that expectations of inflation could increase, especially given the growing pressure from the White House to lower interest rates, adding momentum to inflation. (Market participants may come to see the Fed’s independence curtailed by an adverse outcome from a legal battle over the President’s ability to remove Fed policymakers or by perceptions that the Fed has capitulated to the President’s demands. Considerable evidence has been amassed to demonstrate that jurisdictions with independent central banks have lower and more stable inflation than those that are controlled or heavily influenced by the executive branch.)
To date, the news on longer-term inflation expectations has been somewhat mixed. The chart below, showing expectations of inflation for the five-year period starting in five years derived from Treasury yields, indicates that longer-term inflation expectations of inflation remain in the range of recent years. (However, recent market turmoil may be lowering nominal Treasury yields relative to TIPS yields, thereby understating this measure of inflation expectations).

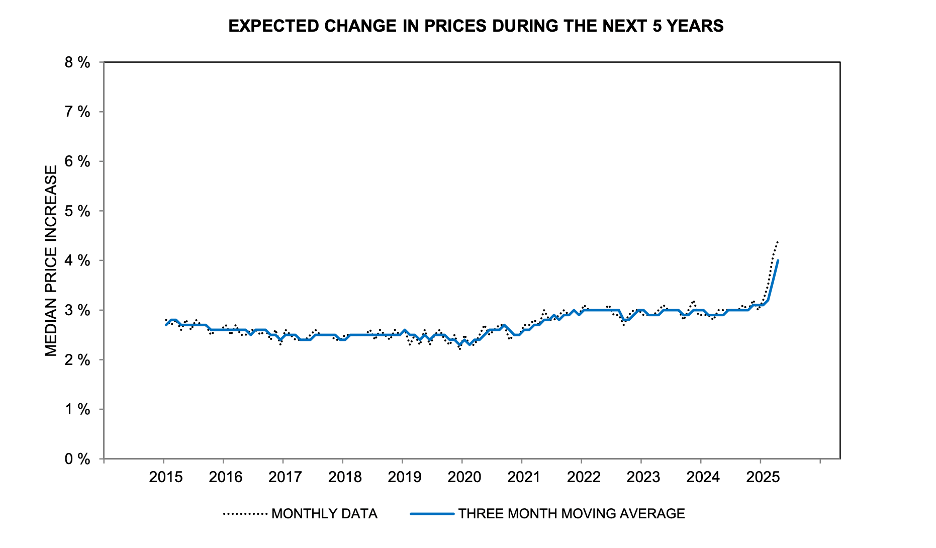
In contrast, the Michigan survey of consumer inflation expectations, the next chart, has been showing longer-term inflation expectations of consumers clearly moving upward. Higher expectations of inflation would require a more restrictive monetary policy by the Fed to restore price stability.
What is clear at this time is that the road ahead will be untrodden and rocky. Tighten your seatbelt and hold on tight!
Featured Image: Kostiantyn Li/Unsplash
