
The release of the 0.5 percent drop in real GDP in the first quarter of this year amplified concerns about the economy sliding into a recession. While data show clearly that the economy slowed in the first quarter, it seems unlikely that GDP actually fell.
The scurry to beat tariffs by importing goods ahead of tariffs earlier in the year led to some understating of output. In an arithmetic sense, imports are a negative and, taken alone, lower real GDP. However, imports, when they arrive in the United States, either go into inventory investment or are sold to businesses or households — both positive contributors to real GDP, which offset fully the negative contribution of imports. Moreover, once the goods arrive in the United States, they get transported to a warehouse or final destination, which creates value added and actually adds to GDP when everything gets measured correctly. What is highly probable is that, as more information is gathered on inventories and final sales, GDP in the first quarter will be revised upward.
Other evidence points to ongoing expansion in the economy in early 2025. Real final sales to domestic purchasers (consumers and businesses) grew at a hefty 3 percent annual rate in the first quarter, the same pace that final sales grew over the four quarters of 2024.
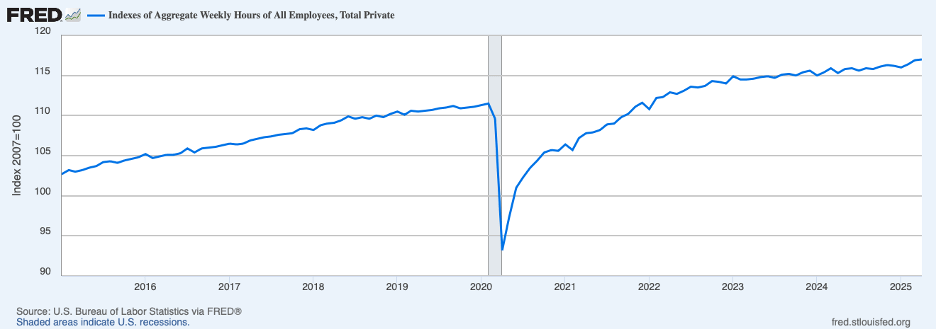
In addition, hours worked by employees in the private sector edged higher in the first quarter, as shown in the chart below. Growth in total output equals growth in hours plus growth in labor productivity. Even though growth in hours was only 0.1 percent, growth in productivity likely was positive (once GDP data are revised upward), implying positive growth in real GDP in the first quarter. Moreover, hours in April were up more than 2 percent (at an annual rate) from the first quarter which, along with productivity gains, implies a good pickup in growth in real GDP in the second quarter. (Employment data also display a pickup in April, rising 177 thousand last month from average monthly gains of 136 thousand in the first quarter.)
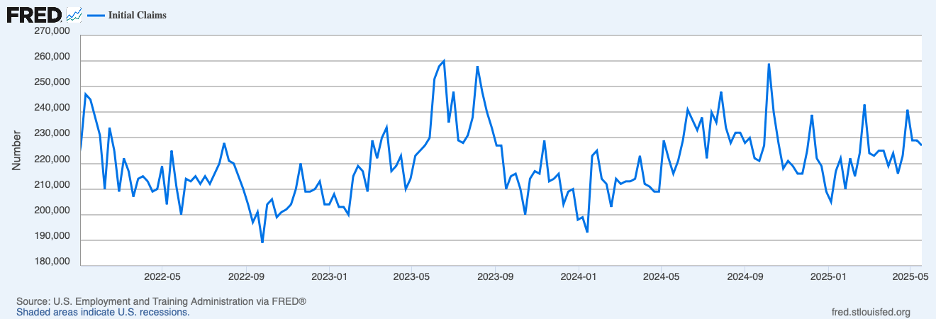
Finally, initial claims for unemployment insurance stayed low through mid-May, as shown below, which effectively rules out the onset of a recession. (Of note, a popular definition of recession is two consecutive quarters of decline in real GDP; however, the economics profession relies on the decision of the National Bureau of Economic Research, which looks at a wide variety of economic data, not just real GDP, to determine whether those data collectively indicate that a recession has begun.)
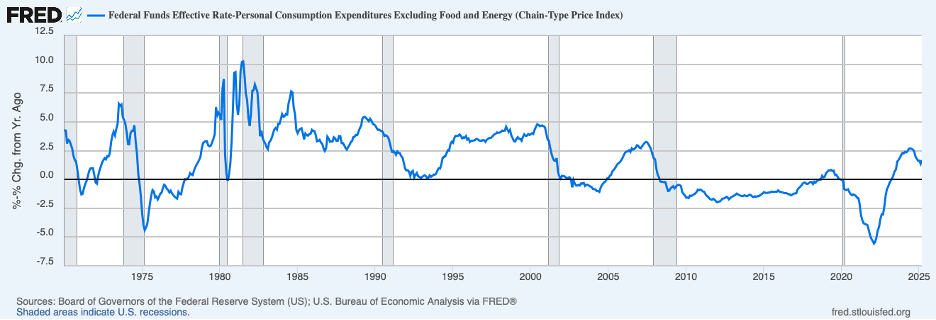
Recent expansion in employment and output suggests that monetary policy is not particularly restrictive. The next chart shows the real federal funds rate (the nominal funds rate less the twelve-month percent change in core PCE prices) through March of this year. At roughly 1-3/4 percent, this rate is not very high by the standards of the last half-century. (The equilibrium real rate —also known as the neutral or natural rate — may have declined in the wake of the financial crisis of 2008, and thus comparisons of the current real rate with earlier periods may understate the degree of monetary restraint, even allowing for a decline in the neutral rate, it is likely that the current real interest rate is not very restrictive.)
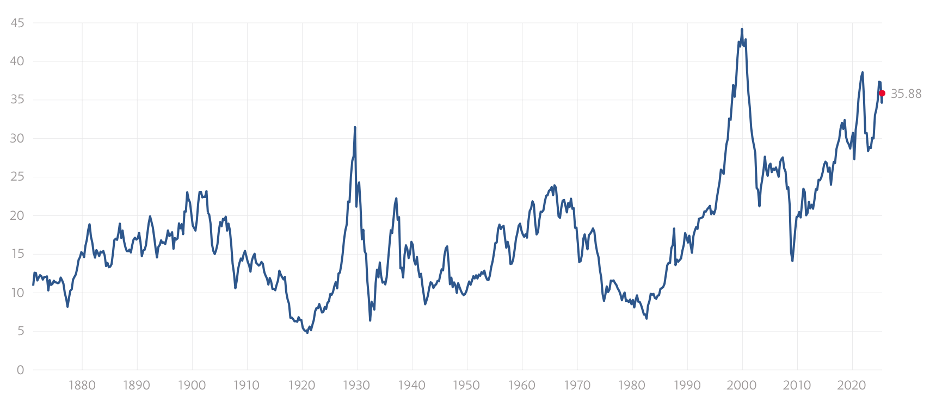
Further suggesting that monetary policy is not very restrictive is the equity price-earnings ratio (which typically is depressed during a period of monetary restraint because expected earnings are being discounted at a higher rate). The next chart shows the (Shiller) cyclically adjusted price-earnings ratio for the S&P 500. This ratio remains at the upper end of historical experience despite all the recent turmoil in the equity market.
Cyclically Adjusted S&P 500 P/E
Even though a recession is not on the immediate horizon, substantial headwinds have developed owing to uncertainty about economic policy, primarily trade policy. These headwinds can be seen in the next chart, showing that the index of policy uncertainty is at an outsized level. In such circumstances, businesses can be expected to pause investment decisions until there is clarity about the likely outcome of trade disputes. Consumers, too, can be expected to be cautious about spending in the face of uncertainties about tariff effects on employment.
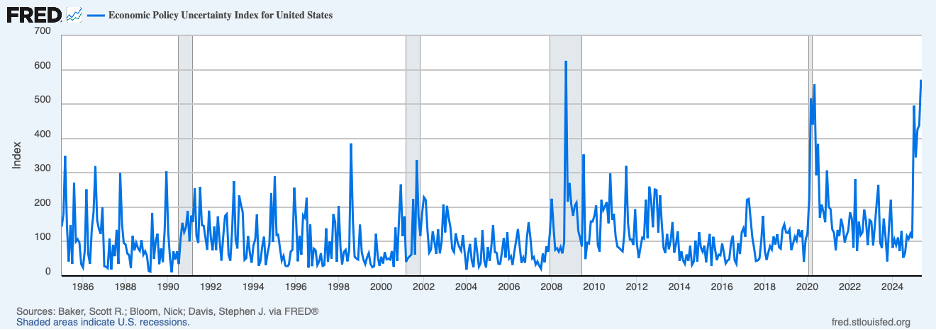
Going forward, we can expect tariffs and greater uncertainty to restrain output and employment. Tariffs will also be pushing up consumer prices.
Turning to consumer prices, the CPI does not appear to have yet been impacted much by tariffs. The following chart shows that the twelve-month percent change in headline CPI prices (the dotted green line) ticked down to 2.3 percent in April from 2.4 in March. Meanwhile, core inflation (the solid blue line), a better indicator of underlying inflation, was unchanged in April at 2.8 percent. Both headline and core inflation are a good bit lower than a year earlier — headline by ¾ percentage point and core by a full percentage point.

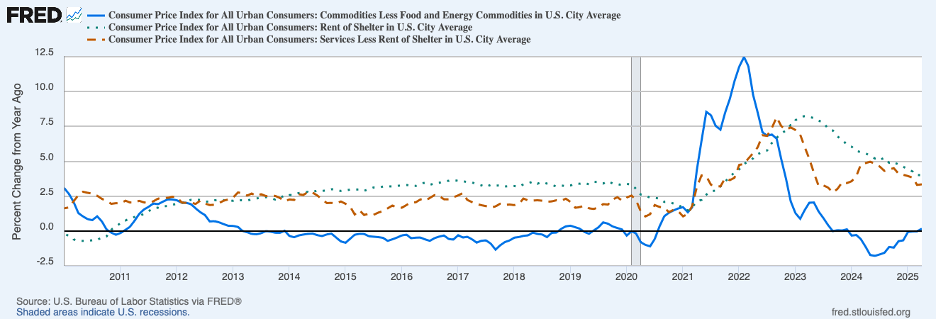
Digging a little deeper into inflation trends, the next chart breaks down core CPI inflation into three major components: core commodities prices (the solid blue line), rent of shelter (the broken red line), and service prices less rent (the dotted green line). Core commodity price inflation turned positive in April for the first time in more than a year, while both rent of shelter and other service price inflation were unchanged from March. Summing up, recent CPI data suggest that the disinflation process was slowing and may have stalled out, even before the impact of tariffs.
As the full impact of the tariffs is felt and consumer price inflation picks up, the primary concern will be whether the boost to consumer prices is one-off (“transitory”) or whether it is going to be more persistent. The answer to this question depends importantly on whether longer-term inflation expectations get boosted by forthcoming increases in actual consumer price inflation.
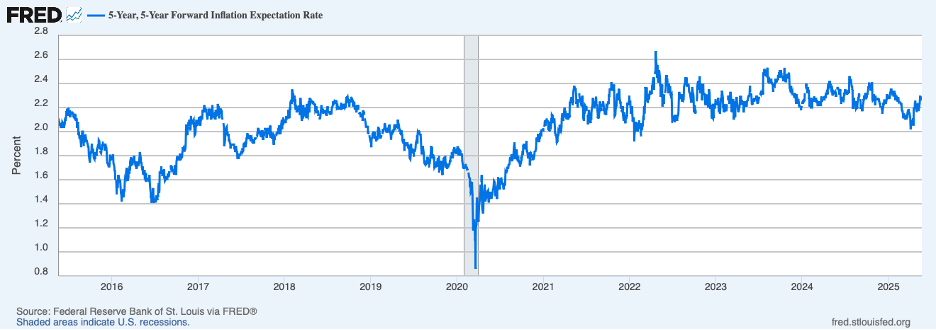
Recent evidence on longer-term inflation expectations, while somewhat mixed, may suggest that longer-term inflation expectations started to increase even before tariff effects. Shown next are five-year ahead expectations of inflation for the period starting in five years derived from the market for nominal and inflation-protected Treasury securities. Since early April, the time of the tariff announcement, this measure has been on the upswing.
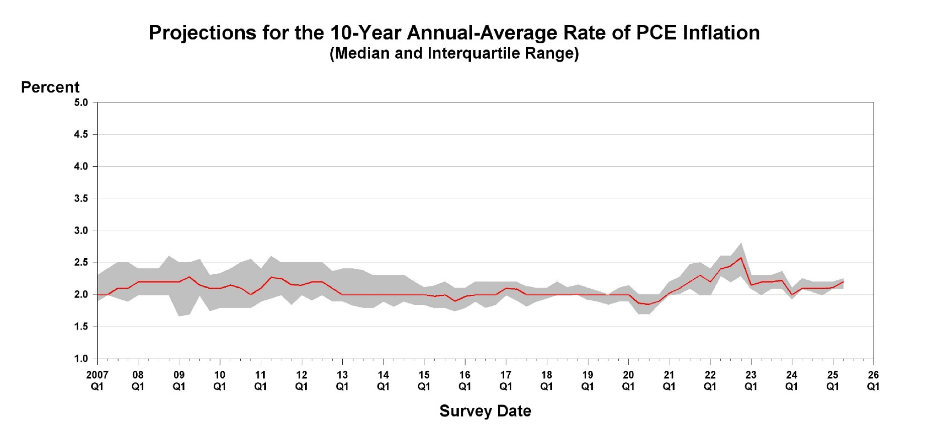
Shown next are expectations of longer-term inflation by professional forecasters surveyed by the Federal Reserve Bank of Philadelphia. In the most recent survey conducted in May, the median forecast of longer-term expectations of inflation moved higher.
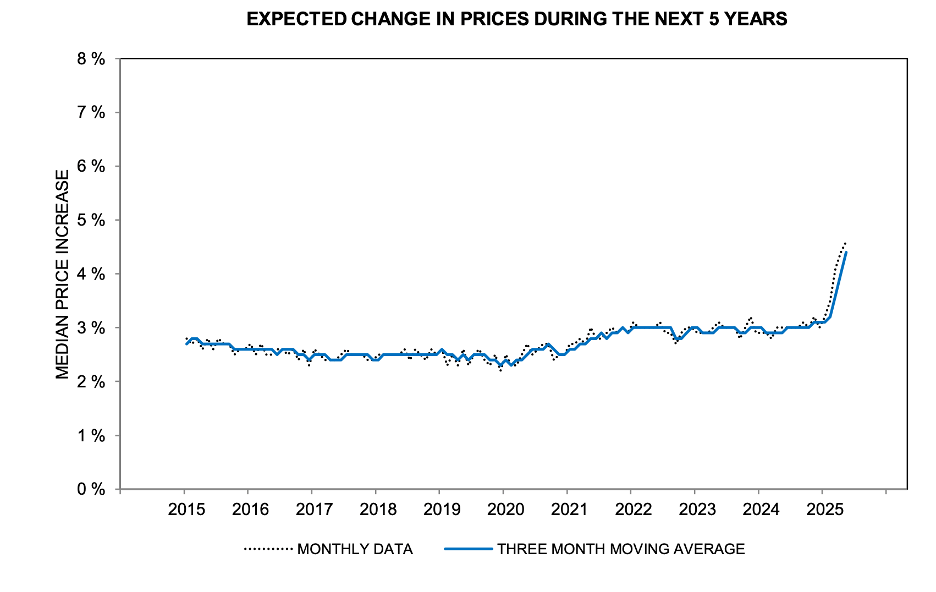
Moreover, longer-term expectations of consumers, from the Michigan Survey of Consumers, continued to increase well above the range that characterized the pre-COVID period of low inflation.
If, indeed, longer-term inflation expectations have begun to deteriorate, the job of the Fed has gotten even harder. (Attacks on the Fed’s monetary policy and its independence coming from the White House run the risk of further eroding longer-term inflation expectations, compounding the difficulty faced by the Fed in restoring price stability.) As actual consumer price readings increase, against the backdrop of restraint on employment and output from the tariffs, the Fed will need to be careful not to inflame sensitive inflation expectations by easing policy in response to evidence that the labor market is softening. (In its last set of projections, submitted in mid-March, Fed policymakers were projecting 50 basis points in rate cuts by year-end; observers will be paying close attention to projection updates by Fed policymakers in June, especially in light of the larger-than-expected tariff hikes announced in early April.)
Ultimately, the Fed will achieve its dual mandate of maximum employment and stable prices only when inflation expectations are fully aligned with its 2 percent target (for PCE inflation, which tends to run below that of CPI inflation by around 0.4 percentage points). Given the near-term outlook for tariff effects on employment and inflation, getting to the point where inflation expectations match the Fed’s target may require greater tolerance for softer conditions in the labor market, a prospect that is not welcome.
Featured Image: Ian Taylor/Unsplash
