
The CPI release for July fell in line with expectations and was greeted enthusiastically by market participants, propelling stock prices to a new high. Moreover, expectations of a rate cut by the Fed in mid-September, which were heightened earlier in the month by a disappointing jobs report for July, rose further.
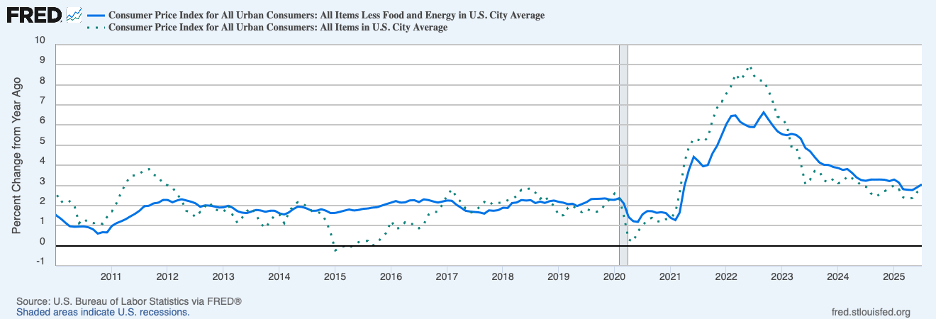
The headline CPI increased 0.2 percent in July, raising twelve-month headline inflation to 2.7 percent (the dotted green line in the chart below) from 2.6 percent in June. Similarly, the 0.3 percent increase in the core CPI caused twelve-month inflation to move up to 3.0 percent (the solid blue line) from 2.9 percent in June.
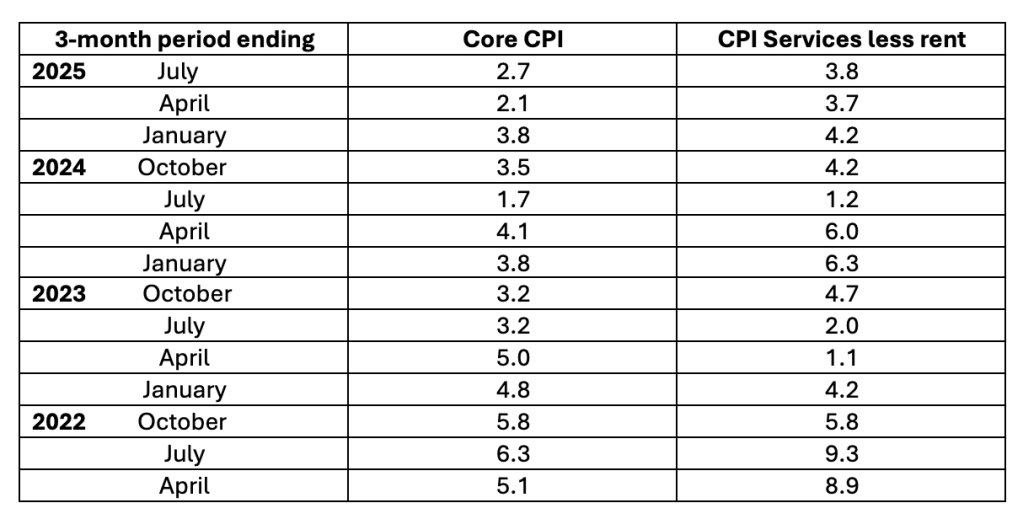
The table below, showing annualized three-month increases in the core CPI in the second column suggests some moderation in core inflation in 2025 from 2024 but not most recently.
A major question before policymakers is the impact tariffs are having on inflation readings, notably prices of commodities. The next chart breaks out core CPI prices into prices of commodities (less food and energy, the solid blue line), rent of shelter (broken green line), and services less rent (broken red line). The twelve-month increase in core commodity prices rose to 1.1 percent in July from 0.6 percent in June. Tariff effects contributed to this pickup but by a smaller amount than many analysts were expecting.
Rent of shelter continued to decelerate through July, to a degree owing to the reversal in immigration, and the twelve-month change, at 3.6 percent, was only a shade above the pace prior to the pandemic. (A shift in immigration trends will have a notable impact on housing prices and rents because the supply of housing does not respond much to the corresponding shift in demand.) The twelve-month increase in prices of services less rent of shelter, in contrast, picked up to 4.0 percent in July. Moreover, the annualized three-month increases, shown in the last column of the table above, have not shown much slowing in 2025 from 2024 and continue to run well above the pre-COVID period. This finding is showing that underlying inflation is proving to be more stubborn than many had hoped.

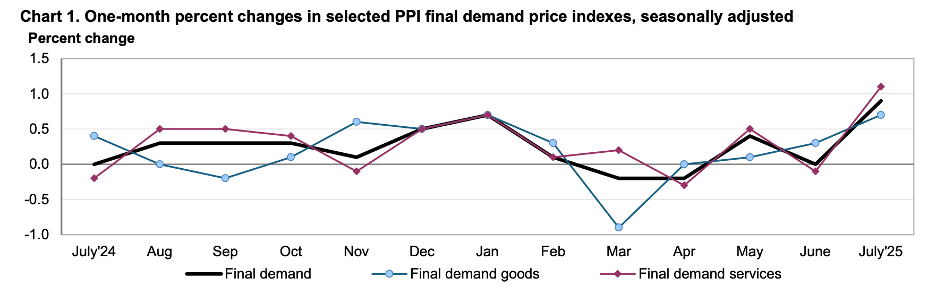
Turning to producer prices, the next chart shows that both final demand producer prices of goods (blue line) and prices of services (red line) jumped higher in July. The increase in the price of goods importantly reflected tariffs, more so than the tariff-effects on consumer prices, which suggests that business profits are absorbing a lot of the higher tariffs at this point. Going forward, one can expect more of the higher costs coming from tariffs will be passed along to consumers. Of greater concern is the pickup in service prices which is broadly consistent with consumer service price readings discussed above and is unlikely related to tariffs. This pickup, too, is suggesting ongoing momentum to the inflation process.
Meanwhile, corporate earnings reports for the second quarter have been surprisingly strong, especially given the dent made by tariffs. The increase in corporate profits overall from a year earlier was likely in the double digits in the second quarter and fueled new record highs for share prices. Earnings have been particularly strong in the IT sector, especially for companies involved in AI, and for companies that are providing infrastructure to support growing IT demands.
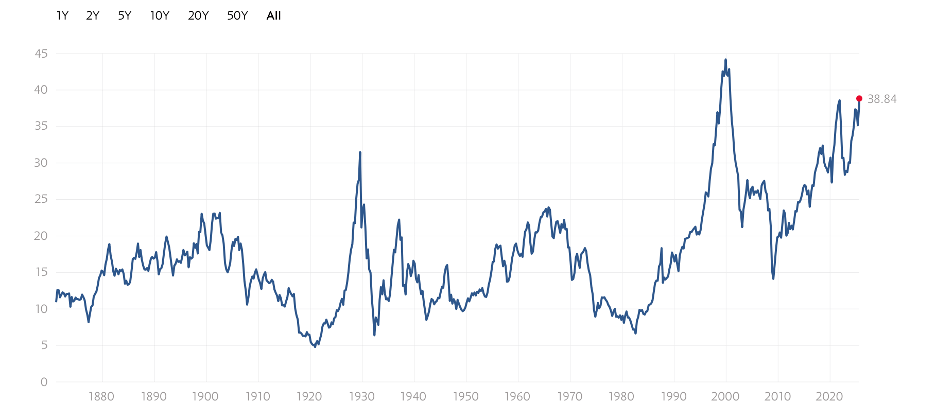
The next chart shows that the S&P share price to cyclically adjusted earnings is extremely high by historical standards, indicating that market participants are expecting continued robust earnings growth. If those expectations are realized, the pace of growth in labor productivity will quicken, boosting growth in output and helping to restrain inflation. Determining the path of the effects on profits and productivity of the boom in AI in coming quarters will be hard to pinpoint, though. If those effects are slower to be realized, the stock market could cool.
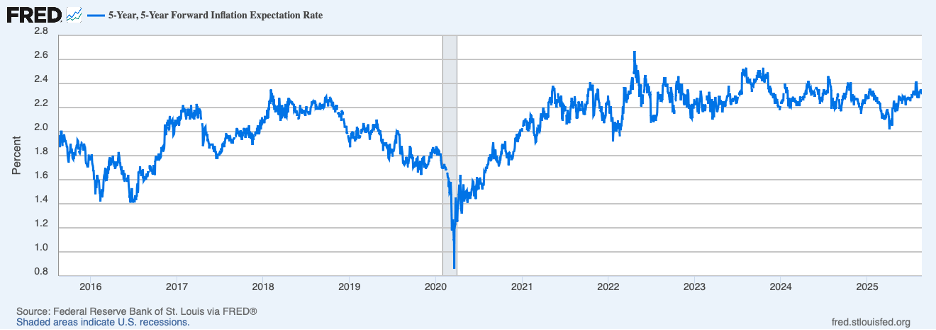
Key to restoring price stability in the face of stubborn service prices and tariff effects will be inflation expectations. If inflation expectations move higher in response to higher prices coming from tariffs, more monetary restraint will be needed to bring down underlying inflation. The next chart shows inflation expectations for the five-year period starting in five years derived from the market for Treasury securities using yields on nominal-yield and inflation-protected securities. Those expectations have been boosted recently by threats to the Fed’s independence coming from the White House and remain above levels prior to COVID.
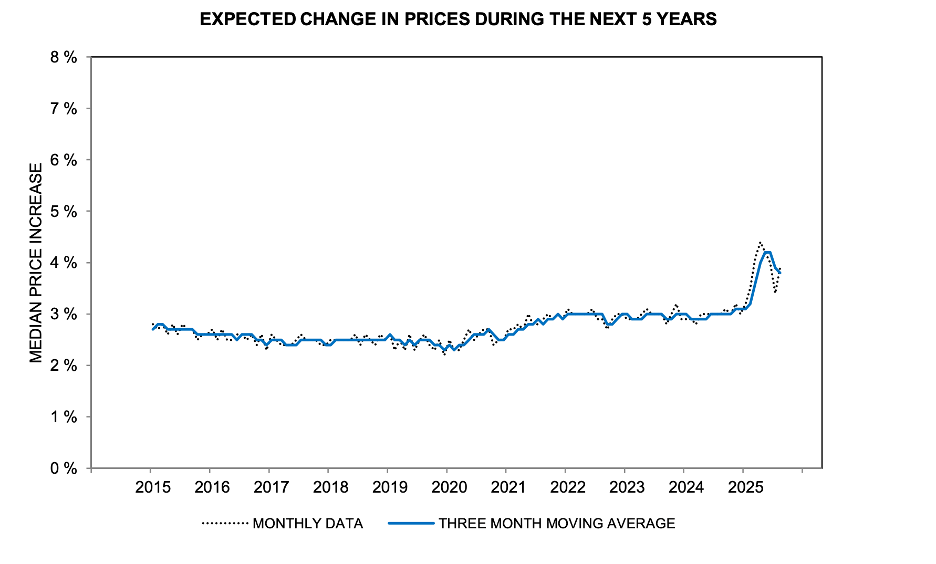
A somewhat similar story is told by consumer expectations of inflation over the next five years from the Michigan survey of consumers, shown below. The most recent upturn reversed a previous decline and the three-month average remains well above the pre-pandemic period.
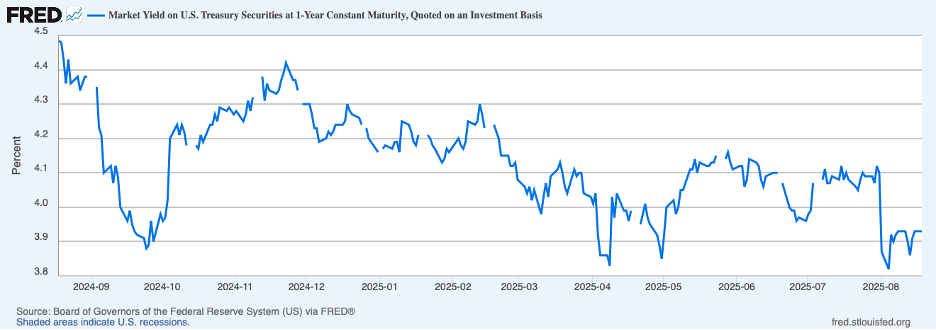
As noted, market participants have a high degree of confidence that the FOMC will lower the target for the federal funds rate when it meets next in mid-September. The chart below shows the yield on a one-year Treasury bill which essentially is the average federal funds rate expected over the coming year. At around 3.9 percent, roughly 40 basis points below the current federal funds rate, this yield implies that the FOMC is expected to make roughly three 25-basis point cuts in the federal funds rate over the coming year.
The argument for rate cuts is based on the belief that the current level of the federal funds rate is roughly 125 basis points above the neutral level (the level of the federal funds rate that is neither restrictive nor stimulative) and that the labor report for July was showing an appreciable softening in conditions in the labor market. Average monthly gains in private sector employment were only 51 thousand for the three months ending in July, after sizable downward revisions for several previous months; these gains were well below the 108 thousand average over the first four months of the year, a rate that was broadly in line with the pace of job growth required to absorb new entrants into the labor force. (Historically, a string of downward revisions to employment, such as revealed in the July report, has been associated with a weaker economy and often a recession.)
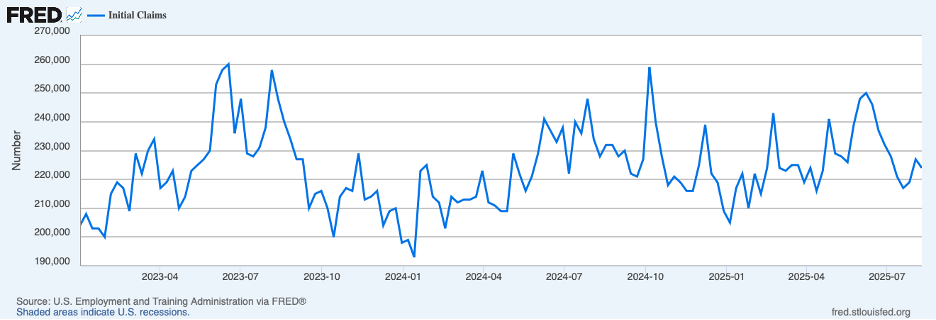
The July labor report also showed that the labor force participation rate declined for the second consecutive month, which likely held down the increase in the measured unemployment rate for that month. At the same time, however, initial claims for unemployment insurance, the following chart, continue to be very low.
Putting together recent news on the labor market, there has been a moderation in labor market conditions, as might be expected as tariffs begin to bite, but the labor market remains in fairly good shape. Moreover, early estimates of growth in output for the third quarter point to continued momentum. The FRB Atlanta estimates that real GDP is growing about 2-1/4 percent in the third quarter, in line with or slightly above growth in potential GDP.
Turning to Fed policy, the risks of a weaker labor market have risen a bit recently while inflation continues to run stubbornly above the Fed’s 2 percent target. A common tool for judging whether the current setting of the federal funds rate is in line with the Fed’s dual mandate of maximum employment and stable prices is the Taylor rule. Shown below are three prescriptions for the federal funds rate based on three versions of the Taylor rule along with the current level of the federal funds rate.

The prescribed settings range from 4-1/8 to 5-1/4 percent which includes the current level. It is worth noting that these prescriptions are based on a neutral level of the federal funds rate of 3 percent (a 1 percent level of the real federal funds rate) which is below longer historical norms (around 4 percent for the nominal federal funds rate and 2 percent for the real rate). If these norms were to be used instead, the prescription for the federal funds rate would be one percentage higher. In light of these considerations, a cut in the federal funds rate in the near term would seem to be a highly risky move, absent substantial deterioration in the labor market beyond what has been observed recently.
Featured Image: Haomeng Yang/Unsplash
