
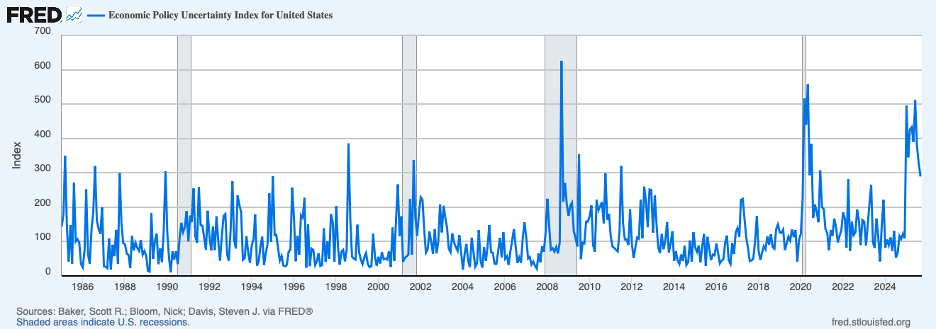
Crosscurrents are affecting the U.S. economy. Uncertainty about U.S. economic policy (shown in the chart below) remains exceptionally high. This uncertainty reflects the vicissitudes of tariff policy and worries about Fed independence. inducing some caution on the part of business and consumer spenders. Conversely, prospective returns on business investment are getting a boost from broad-based deregulation and from investments in AI and supporting infrastructure.
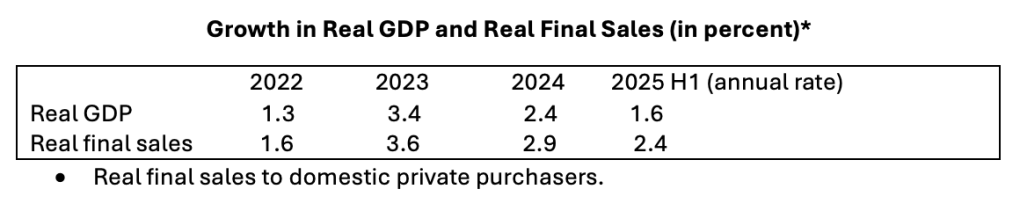
Growth in output and employment have slowed in 2025, partly owing to the dramatic turnaround in immigration. In addition, tariffs, a form of tax, are holding down output and employment and pushing up prices, especially prices of commodities. Nonetheless, there appears to be momentum in growth of output and aggregate demand. The table below shows growth in real GDP through the first half of this year. Real output is measured to have slowed to 1.6 percent at an annual rate over the first half of 2025 and is on track for 3+ percent growth in the third quarter. Unusual patterns of growth over the first half of this year, at a time when imports surged in the first quarter and GDP is estimated to have contracted, raise questions about whether the estimates may have been distorted. A better indicator of underlying demand in these circumstances is real final sales to domestic private purchasers (real personal consumption expenditures plus real investment) shown on the bottom line of the table. Real final sales also slowed in the first half of the year, but to a lesser extent than GDP. (The other components of aggregate demand—net exports and government outlays—had essentially a neutral effect on growth in aggregate demand over the first half.) Moreover, growth in final sales exceeded growth in potential GDP which is estimated to be around 2 percent. Thus, there is some ongoing momentum in aggregate demand propelling the economy forward, despite the heavy headwinds.
Concern about emerging labor market weakness has been heightened by recent monthly jobs reports. The Labor Department reported that employment increased only 22 thousand in August, bringing the average over the three months ending in August to 29 thousand per month. Over the first eight months of this year, employment gains averaged 75 thousand per month. These 2025 figures are to be contrasted with job gains of 168 thousand per month in 2024 and 216 thousand in 2023. Much of the slowing in job growth owes to the turnaround in immigration policy and the accompanying sharp slowing in foreign-born workers entering the labor force. It is estimated that the number of new jobs needed each month to absorb new workers entering the labor force currently has dropped to roughly 50 thousand, down more than 100 thousand per month from recent years.
To get a better understanding of forces at work in the labor market, the next chart shows job openings the (solid blue line) and layoffs (the broken green line) through July (most recent data). The chart shows that cooling of the labor market over recent months has come from fewer job vacancies and very little from layoffs. Layoffs remained low through July.

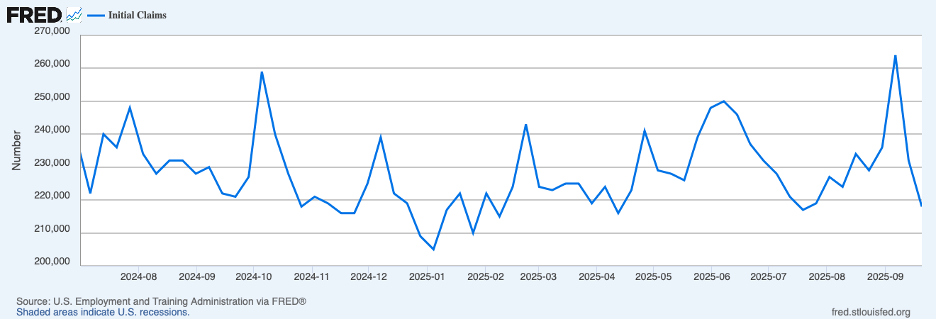
Initial claims for unemployment insurance, a more current indicator of layoffs, are shown in the next chart. Claims had been running low through most of August but jumped at the start of September, raising concern that the labor market had taken a turn for the worse. However, a surge in claims in Texas, thought to be tainted by fraud, appears to account for much of the spike in early September (also, difficulties in capturing seasonal movements, especially around the Labor Day holiday, may have accounted for some of the spike). Initial claims over the following two weeks returned to the low levels of earlier this year.
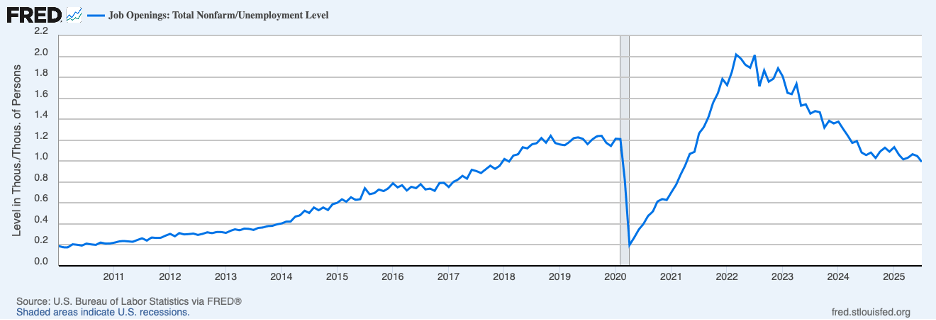
Summing up, the labor market appears to have cooled over recent months. However, it continues to be functioning reasonably well as suggested by initial claims for unemployment insurance and by the ratio of job openings to the number of unemployed workers shown in the next chart. There are roughly the same number of job vacancies as there are persons unemployed, a pattern that has characterized earlier periods when conditions in the labor market were considered to be solid.
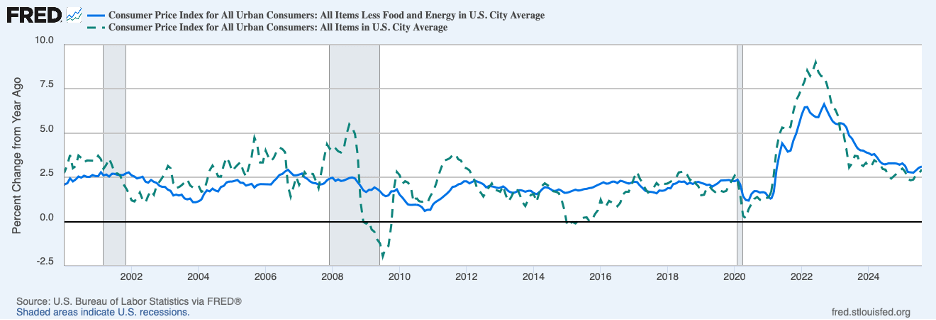
Meanwhile, inflation has continued to run stubbornly above the Fed’s 2 percent target. Indeed, core inflation was faster in the three months ending this August than over the same period a year earlier. With inflation continuing to run a good bit above the Fed’s 2 percent target, the Fed is faced with a serious dilemma in achieving its dual mandate of maximum employment and price stability. Lowering interest rates to counteract concerns about a prospectively softening economy raises the upside risk of ongoing inflation while raising rates to counteract persistent inflation adds to the risk of labor market weakness.
Looking at inflation in greater detail, the next chart shows that twelve-month changes in both the headline CPI (the dotted green line) and the core CPI (the solid blue line) turned up in August. Headline inflation was a little higher than a year ago (2.9 percent versus 2.6 percent) while core inflation was a touch lower (3.1 percent versus 3.3 percent).
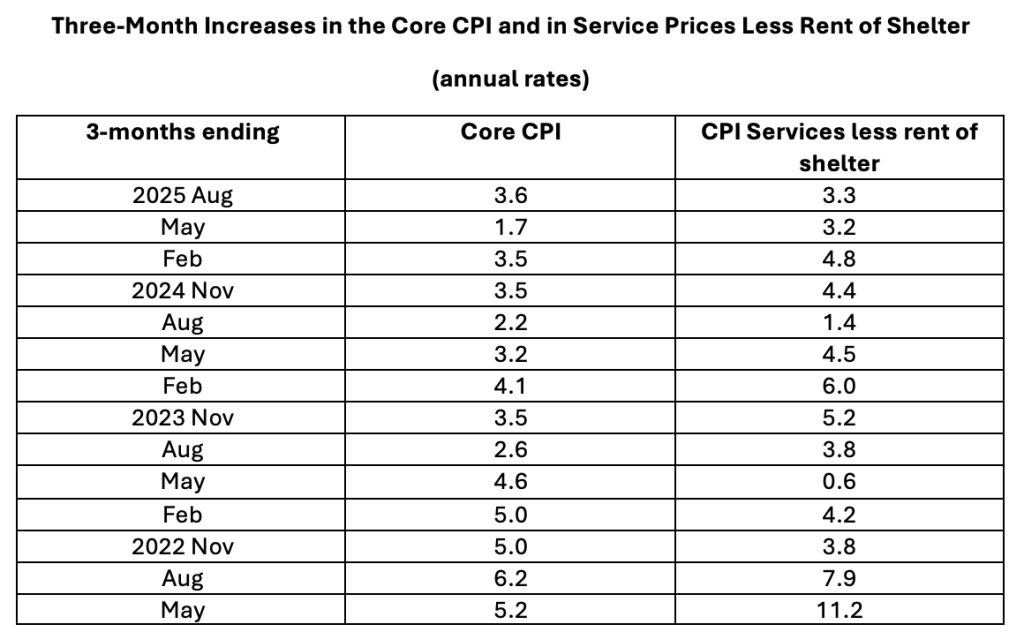
Looking at shorter periods, the second column in the table below (presenting annualized three-month increases for periods ending in the months shown) does not point to a slowing of core inflation in recent months. Indeed, the table shows that core inflation rose a good bit faster in the three months ending this August than over the same period a year earlier.
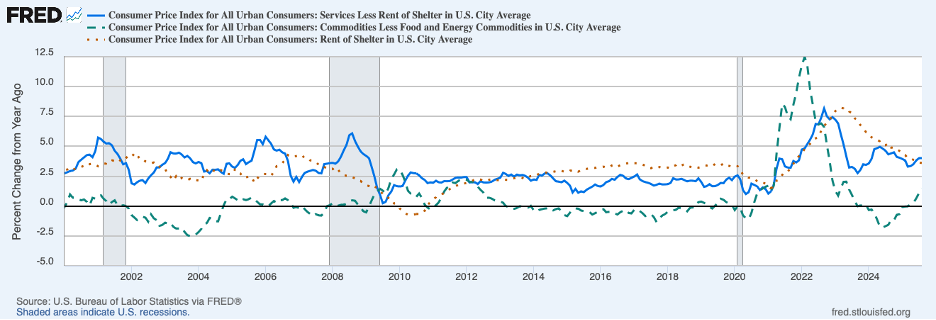
A pressing question regarding recent news on inflation has to do with the extent to which tariffs have been boosting consumer prices. The effects of tariffs will be mostly be seen in commodities prices. The next chart decomposes twelve-month changes in the core CPI into core commodities prices (the broken green line), rent of shelter (the dotted red line), and service prices less rent of shelter (the solid blue line). Looking first at prices of commodities, the chart shows that commodity price inflation continues to increase. The twelve-month change increased to 1.5 percent in August, in contrast to a decline of 1.6 percent a year earlier. A number of commodity groups with high import content have registered large increases in prices over recent months, although the increases in commodity prices overall have fallen short of what would be expected if consumers were shouldering all of the burden of the tariffs. This leaves the burden on either foreign suppliers or domestic businesses.
There is scant evidence that foreign suppliers have borne much of the tariffs as import prices before tariffs, shown next, have been little changed over the past year.
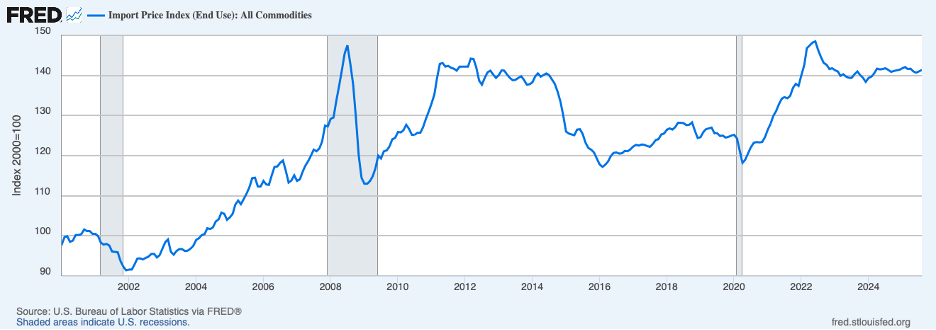
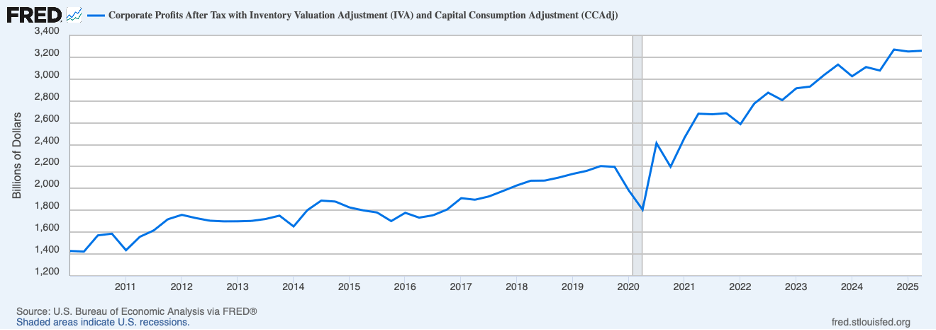
The implication is that much of the burden of the tariffs has been absorbed by U.S. businesses. Indeed, the general upward trend in corporate profits, shown in the next chart, seems to have been interrupted in the first half of this year. Surveys of domestic businesses indicate that those businesses affected most by tariffs plan to pass more of their tariff costs onto consumers in the months ahead.
Returning to the CPI decomposition chart, the increase in rent of shelter stayed at 3.6 percent in August, a little above the pace before the pandemic. The twelve-month increase in the price of services excluding rent, perhaps the best current indicator of underlying inflation, remained at 4.0 percent in August—well above the pre-pandemic pace. Moreover, the final column of the table above does not show slowing in this service component of prices in recent months compared to the same period a year earlier.
We can summarize the discussion of consumer price inflation by noting that tariffs are showing through in commodity prices and likely will continue to do so in the months ahead while inflation in service prices (other than rent) remains stubbornly high. This suggests that underlying inflation is not abating. Past episodes of inflation imply a dynamic that results in inflation persisting and requires monetary restraint to place inflation on a downward path toward price stability.
At present, after the cut in the Fed’s target for the federal funds rate on September 17, monetary policy is not providing restraint. That is, the real federal funds rate is around the neutral rate—neither expansionary nor contractionary. Continued momentum in the economy through the third quarter, even against extraordinary headwinds, confirms that monetary policy has not been providing sufficient restraint. Absent a negative shock beyond that coming from tariffs, we cannot expect to see progress in restoring price stability. Moreover, there is a risk that inflation expectations might deteriorate in response to an ongoing rise in commodity price inflation and attacks on Fed independence. Should this occur, the Fed’s job of getting back to price stability would get even tougher.
Header Image: Thomas Thompson/Unsplash
