The release of the CPI data for September was greeted warmly by financial markets. The 0.3 percent increase in the headline CPI and the 0.2 percent increase in the core CPI were in line with expectations. Nonetheless, these data were seen as providing sufficient cover for another rate cut by the Fed, especially when combined with fragmentary data on the labor market suggesting some further softening.
It is worth noting that the annualized increase in the headline CPI in September was 3.7 percent and the core CPI was 2.7 percent, both above the Fed’s 2 percent target. (The Fed’s target is specified for the PCE index and not the CPI; PCE inflation tends to run about 0.3 percent below CPI inflation on annual basis, suggesting that readings on the CPI overstate actual inflation a little. September PCE data will not be available until after the federal shutdown ends.)
Monthly CPI data are volatile and are not reliable for identifying trends. Instead, it is common practice to look at changes over longer periods, such as twelve months. The chart below shows twelve-month increases in the headline CPI (the broken green line) and the core CPI (the solid blue line). The twelve-month increase in the CPI edged up from 2.9 percent in August to 3.0 percent in September while the core CPI edged down from 3.1 percent in August to 3.0 percent in September.

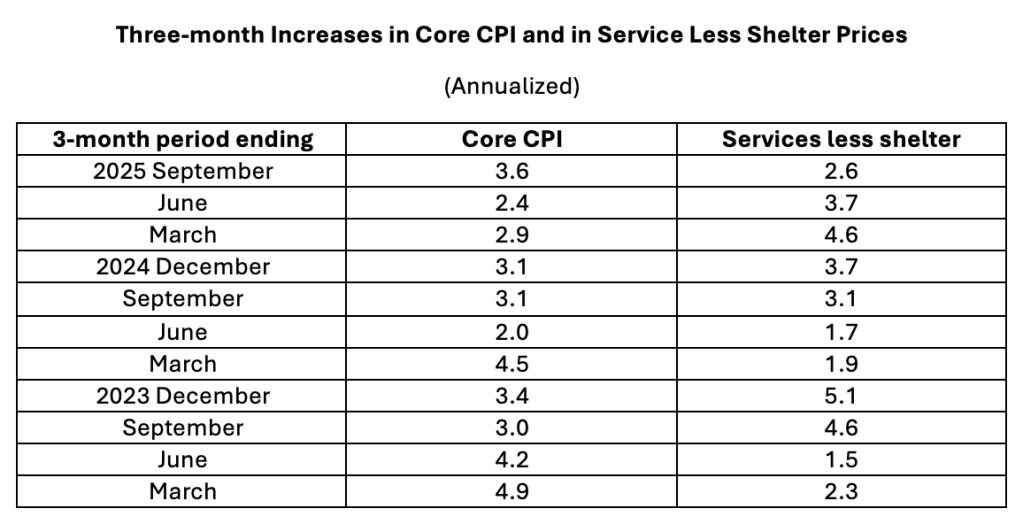
A disadvantage of twelve-month changes is that they are slow to catch a shift in trend, such as a deceleration in prices. The first column in the table below shows annualized three-month changes in the core CPI (commonly believed to be a better indicator of underlying inflation than the headline CPI). The three-month change for the period ending in September was the largest increase in a year and a half and 0.5 percent higher than a year before. (Some observers have expressed concern about whether seasonal adjustment factors used in constructing seasonally adjusted CPI data are fully adjusting for seasonal movements; if this indeed is a problem, comparing the three-month change with that for the same period a year earlier might better capture changes in trend.)
Another factor that might be affecting the interpretation of inflation trends are tariffs imposed earlier in the year. The primary impact of tariffs is expected to be on goods prices. The chart below shows twelve-month increases in CPI goods prices (the green broken line). The twelve-month change has been creeping upward in recent months to 1.5 percent in September, and increases have been especially pronounced among categories having a high import content. Nonetheless, the pass through of tariffs to consumer prices has been only partial to date and it is likely that more tariff-related price increases on consumer goods are in the pipeline.
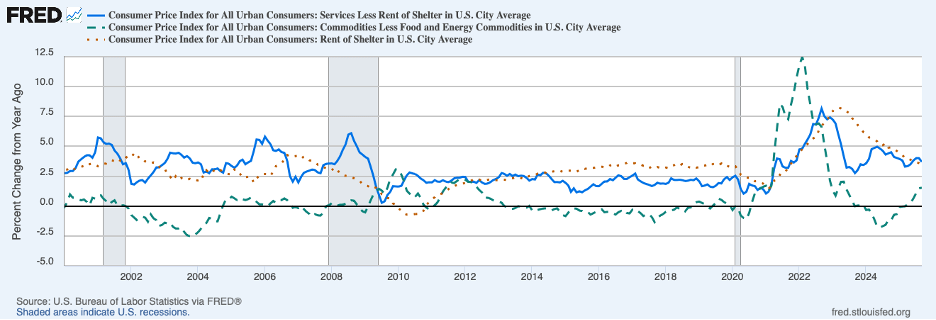
Because tariff effects have been boosting both headline and core inflation measures in recent months, a better indicator of underlying inflation likely is service prices excluding rent of shelter (the blue line in the chart above). This measure of prices ticked lower to 3.7 percent in September, still well above the 2.1 percent pace that characterized the decade prior to the COVID shock and the unprecedented monetary and fiscal policy response. The last column in the table above shows that service-price inflation slowed in the three months ending in September and was below service-price inflation in the same three-month period a year earlier. However, the increase in service prices over the first nine months of 2025 was well above the same period in 2024.
In sum, the September CPI data, while affected by crosscurrents, do not provide clear evidence that underlying inflation has moderated and is on a path to price stability. Moreover, available indicators of growth in real GDP suggest that the economy has gotten a burst in energy. The estimate for growth in the third quarter by the FRB Atlanta is 3.9 percent on the heels of robust growth in the second quarter of 3.8 percent.
Recent output growth appears to run counter to anecdotal reports that the labor market has softened. However, the apparent discrepancy quite likely reflects another strong quarter of growth in productivity enabling output to grow much faster than labor input. With AI applications spreading throughout the economy, it seems that employers have cut back on their hiring. The slowing in hiring has been happening at a time when growth in the labor force also has slowed markedly owing mostly to the turnaround in immigration policy. In the absence of data from federal government sources during the shutdown, it is difficult to tell whether demand for labor has slowed more than supply and, thus, whether slack has developed in the labor market or whether the labor market has remained close to maximum sustainable employment.
The Fed’s policy stance going into its late-October meeting was roughly neutral (neither stimulating nor restraining the economy) which would leave conditions in the labor market unchanged. However, with inflation remaining stubbornly above the 2 percent target, these conditions would not be conducive to progress toward price stability.
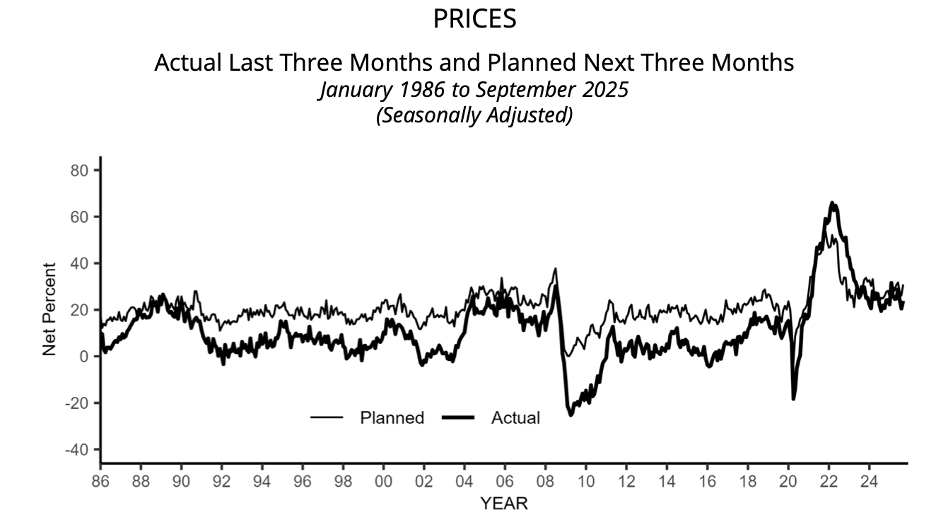
Moreover, an easing policy action is unlikely to assuage inflation worries at a time when the economy is displaying momentum. The next chart shows actual (the thick line) and planned (the thin line) price increases from the most recent survey of small businesses from the NFIB. Planned price increases have turned up most recently and remain above the pre-pandemic period.
On the other side of the market, consumers also are expecting more inflation. The following chart shows that consumer expectations of inflation over the next five years from the Michigan Survey of Consumers has turned even higher in recent months.

Another survey of consumers, conducted by the FRB New York and shown next, indicates that longer-term consumer expectations of inflation have not risen as much.
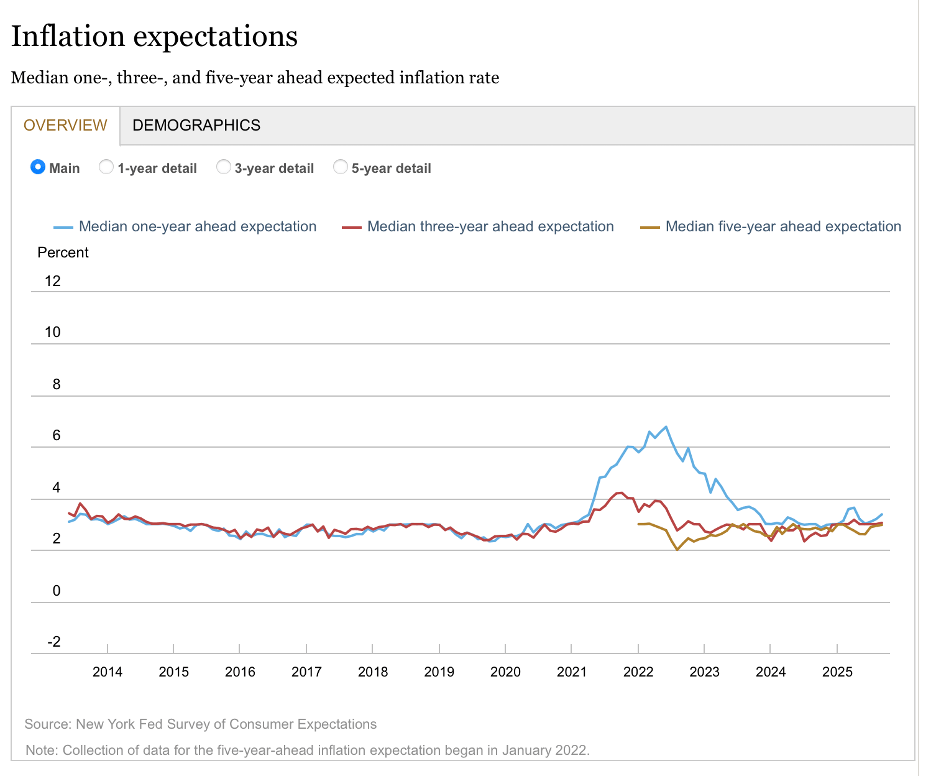
As tariffs continue to push consumer prices higher, the Fed’s challenge of getting consumers and businesses to return to expecting price stability may become greater. In these circumstances, the Fed will have to decide whether to reverse course and raise rates to curb inflation and convince businesses and consumers that price stability is on the horizon or to accept inflation above its longstanding 2 percent target.
