
With the 25-basis point cut in the target for the federal funds rate on December 10, the Fed has lowered this target rate a cumulative 175 basis points in fifteen months. Over this time, inflation has remained stubbornly above the Fed’s 2 percent objective while the unemployment rate moved up from 4.2 percent in August 2024 to 4.6 percent in November 2025. In the December 10 FOMC statement, the Fed emphasized, “….that downside risks to employment rose in recent months.”
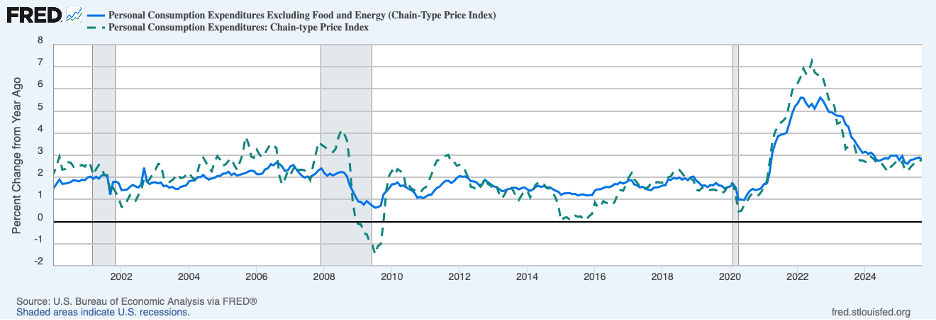
Sometimes, the Fed’s goals of maximum employment and stable prices (the dual mandate) do not conflict. However, often they do conflict—the present time being a prime example. Core inflation, based on the Fed’s preferred PCE index, was 2.8 percent over the twelve months ending in September (most recent data), shown by the blue line below. This is the same percent increase as a year earlier.
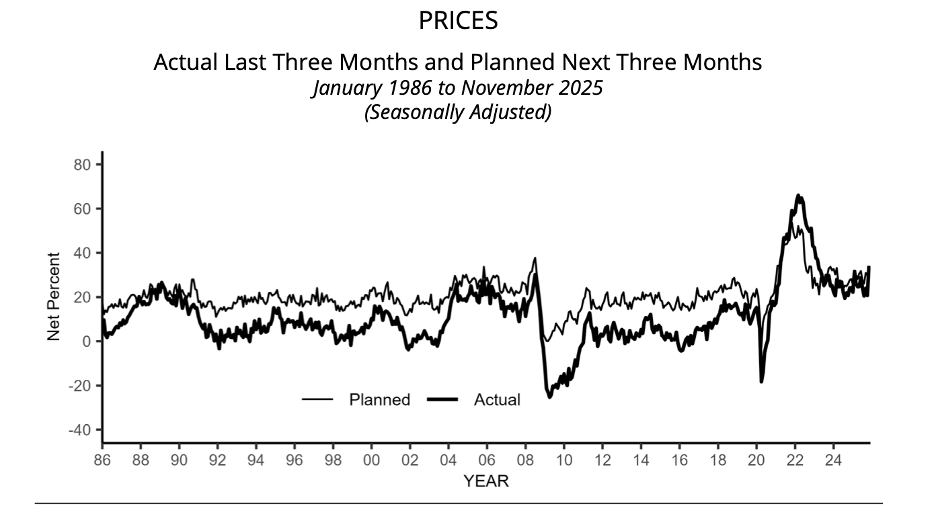
Moreover, the latest survey of small businesses conducted by the NFIB suggests little easing of price pressures more recently, as indicated by the next chart. The thick line shows the net percent of small business respondents that raised prices over the three months ending in November and the thin line shows the net percent planning to raise prices over the subsequent three months. Both lines remain high in relation to the pre-pandemic period when inflation was not a concern. Neither is showing signs of moderating.
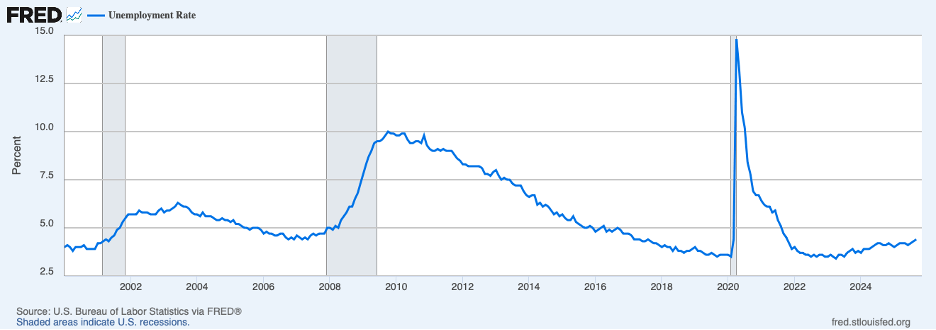
Meanwhile, the unemployment rate, at 4.6 percent in November (shown in the next chart), is a little above the rate that is deemed to be consistent with maximum sustainable employment; however, much of the increase in the unemployment rate over recent months can be attributed to an increase in labor force participation—typically, a sign that people perceive a favorable labor market.
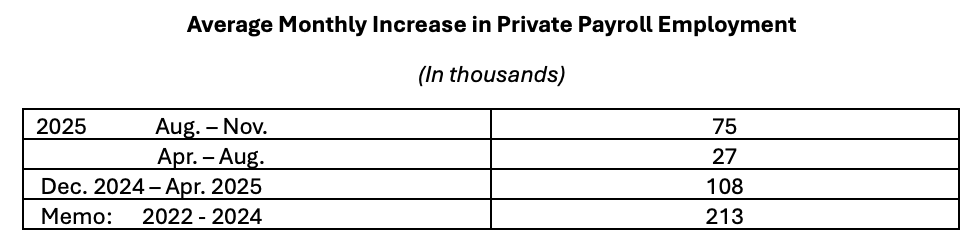
Turning to the survey of employers (Establishment Survey), the table below shows that private employment picked up over the three months ending in November to 75 thousand per month from only 27 thousand over the April to August period. Both are down considerably from the previous three years, but much of the slowdown owes to the sharp decline in immigrants entering the labor market. (Concurrently, there has been a slowing in demand for workers.)
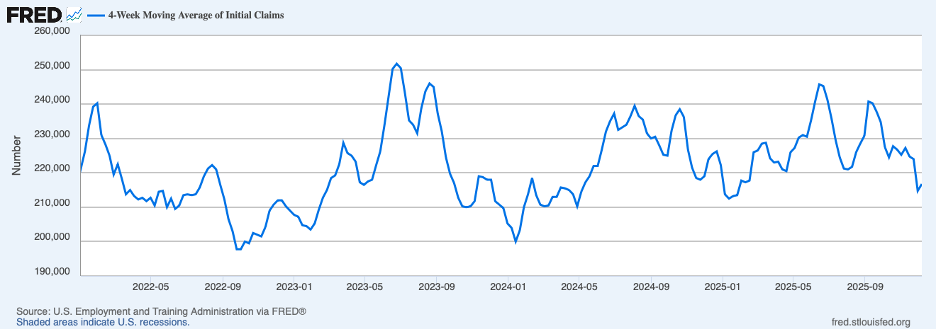
More recent data on the labor market suggest that labor market conditions have been fairly stable (November household and establishment employment data were based on the week that includes November 12). Initial claims for unemployment insurance remained low through early December (the next chart), suggesting that layoffs have not picked up. (The chart shows the four-week average which smooths through volatility around holidays, such as Thanksgiving.) Summing up data on the labor market, employers have been adjusting employment by cutting back on both job openings and hiring but are retaining existing workers and not stepping up layoffs (in November, average weekly hours worked ticked up implying that employers were utilizing current workers to meet demand). Although the labor market is somewhat softer overall than in recent years, it does not appear to have deteriorated much recently.
When the goals of maximum employment and stable prices are in conflict, the Fed’s current Statement on Longer-Run Goals and Monetary Policy Strategy mentions, “However, if the Committee judges that the objectives are not complementary, it follows a balanced approach in promoting them, taking into account the extent of departures from its goals and the potentially different time horizons over which employment and inflation are projected to return to levels judged consistent with its mandate. The Committee recognizes that employment may at times run above real-time assessments of maximum employment without necessarily creating risks to price stability [FOMC, Statement on Longer-Run Goals and Monetary Policy Strategy, August 2025].” Not mentioned in this statement is that stable prices, along with expectations of stable prices in the future, are necessary for achieving maximum sustainable employment.
The period, now known as the Great Inflation, saw inflation rise markedly over the second half of the 1960s and the 1970s and illustrates the importance of achieving low inflation for good overall economic performance. Over this period, inflation climbed from 1-1/2 percent to 10 percent (the broken green line in the chart below). By the end of this period, unemployment was relatively high and inflation had taken on considerable momentum. The situation required the most severe recession in postwar history up to that time (which lasted almost three years) to break the back of inflation and to get it on a path toward price stability. The unemployment rate hovered around 7-1/2 percent or above for more than three years.
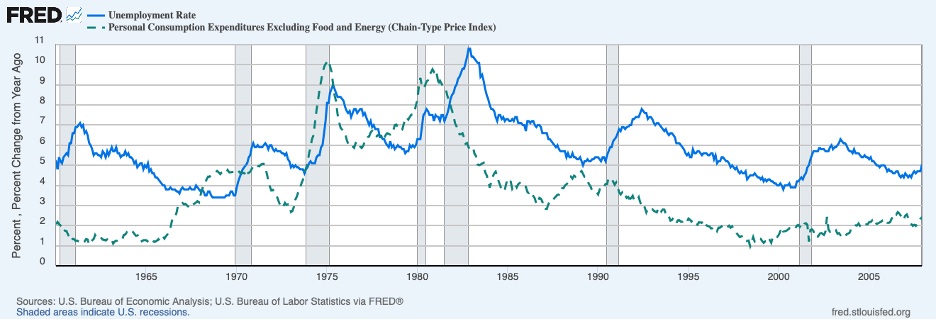
Observers who lived through this period saw firsthand the widespread devastation caused by the stubborn inflation. Some of these observers became Fed policymakers and were determined not to revive inflation to avoid the disruptions caused by inflation.
The nearly quarter-century period following the Great Inflation, starting in late 1982, has come to be labeled the Great Moderation because this was a period when the economy performed very well and inflation ceased to be a concern. The two recessions that took place during this period were short and relatively mild. Moreover, inflation actually drifted down from around 4 percent to around 2 percent.
During this time, Fed policymakers were vigilant in their determination to avoid an upturn in inflation. Early in this period, they recognized that inflation was still above the level they were seeking (though the Fed did not specify a numerical target for inflation until 2012). Fed policymakers decided that they would pursue a strategy of “opportunistic disinflation” under which they would resist upward pressure on inflation using policy restraint but allow negative shocks causing recession to show through in lower inflation (a so-called asymmetric reaction function). This strategy worked very well, largely because policymakers understood that sustained maximum employment required stable prices. A critical lesson to be learned from this episode is that inflation, once it is underway, develops a persistence that becomes difficult to reverse and that leads to vexing policy choices.
The current Fed has tended to underpredict core PCE inflation in recent years. The underpredictions can be seen in the table below showing the forecast of core PCE for the years 2022 to 2025 from projections published in September of the prior year and actual PCE inflation for that year. In addition to persistent underpredictions of annual inflation rates, the Fed has pushed out the date at which price stability will be reached (2.0 percent increase in the PCE index) from 2025 in the Fed 2021 projections until 2028 in the most recent set of projections.

Recent readings on headline and core inflation have been affected by tariffs which are boosting prices of goods, especially those with import content. The chart below shows that PCE goods prices (the broken green line) have been on an upward swing. Goods prices rose 1.4 percent over the twelve months ending in September, a turnaround from the 1.2 percent drop over the twelve months ending a year earlier. Tariffs have played a big role in the reversal.
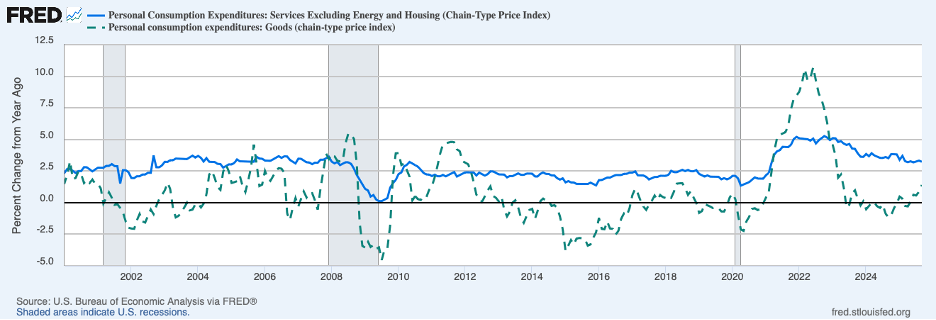
A better indicator of underlying inflation apart from tariffs comes from service prices. The solid blue line in the chart above shows inflation in service prices excluding energy and housing services. This measure rose 3.2 percent over the twelve months ending in September. While this reading was down from 3.5 percent a year earlier, it was still a full percentage point above the rate that prevailed over the decade prior to the COVID pandemic. In sum, the inflation picture is murky, and it is not certain whether or not core inflation is on a steady downward trajectory.
The Fed is of the view that its policy posture has become neutral after the last rate cut—in other words, the real federal funds rate is now in neutral territory where Fed policy is neither stimulative nor restrictive. In practice, the neutral rate, an abstraction, cannot be observed directly and must be estimated. There is a considerable degree of uncertainty about the actual level of the neutral rate; this uncertainty increased considerably in the wake of the financial crisis of 2008 and 2009. The Fed’s assessment apparently is based on the choice of a relatively low value of the neutral rate. Thus, it is quite plausible that the neutral rate is higher than what the Fed has chosen and that the current posture of monetary policy is accommodative—not neutral.
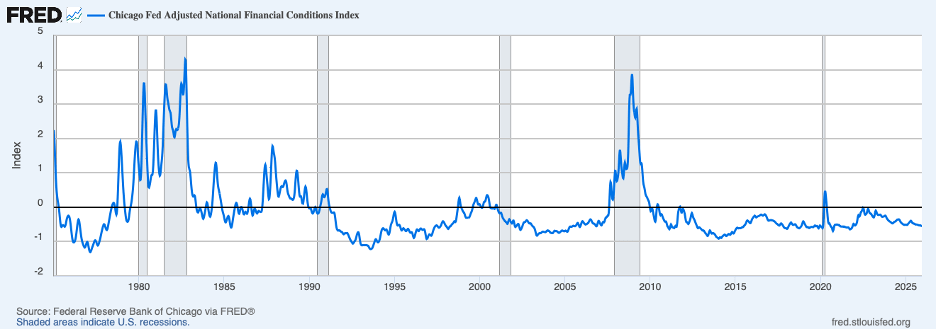
Moreover, broader financial conditions—including the stock market—continue to be very supportive of economic expansion. The next chart shows the Chicago Fed’s national financial conditions index. Values of the index below zero indicate that conditions are more accommodative than average. The chart shows that over the past couple years support to growth has come from the financial sector and that support has risen mildly.
In conclusion, the current Fed, in contrast to the Fed during the Great Moderation, seems to be more inclined to respond to signs of softening in the labor market than to persistent above-target inflation. Under these circumstances, above-target inflation is not likely to go away anytime soon.
Header Image: Anne Preble / Unsplash
