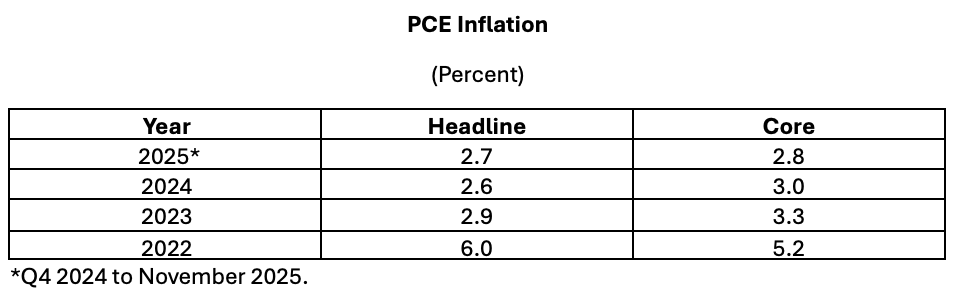
In 2025, headline PCE inflation was roughly unchanged while core inflation edged lower (see the table and chart below). However, core PCE inflation was little changed on a twelve-month basis after the start of the year and both headline and core PCE inflation ended 2025 well above the Fed’s 2 percent target. Consumer prices were buffeted by tariffs and other forces over the year, but as shown in the Annex, it appears that there was not much deceleration over the last half of 2025.
Does the outlook for inflation in 2026 call for relief? In its forecast made in December, the Fed foresaw core PCE inflation dropping to 2.5 percent in 2026, the slowest pace since the 1.5 percent increase in 2020. Evidently, an expected easing of tariff effects on prices contributes to the slowing in core PCE inflation in 2026 in the Fed forecast. Perhaps some of the deceleration also owes to lagged effects from a monetary policy that was thought by the Fed to have been restrictive — a policy interest rate that was thought to be above the neutral rate for much of 2025.
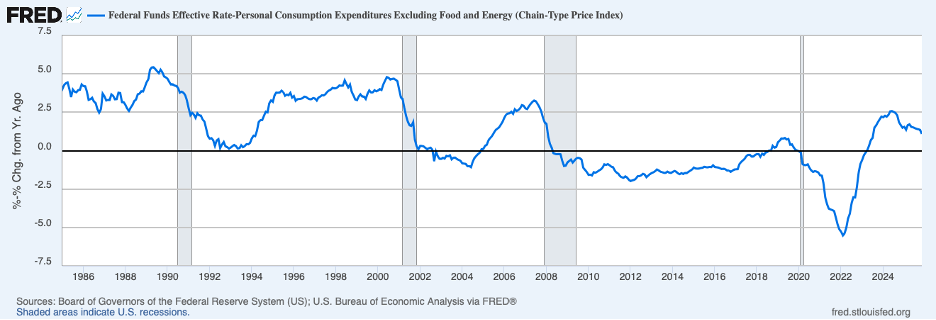
The median Fed policymaker appears to view the neutral real funds rate to be around 1 percent. The chart below presents an estimate of the real interest rate through November of 2025 calculated using the effective federal funds rate less the twelve-month increase in core PCE prices. This measure of the real rate stood at 1.1 percent in November, prior to the 25-basis point cut in the federal funds rate target in December. Adjusting for the December policy action, the real federal funds rate currently is around 0.8 percent.
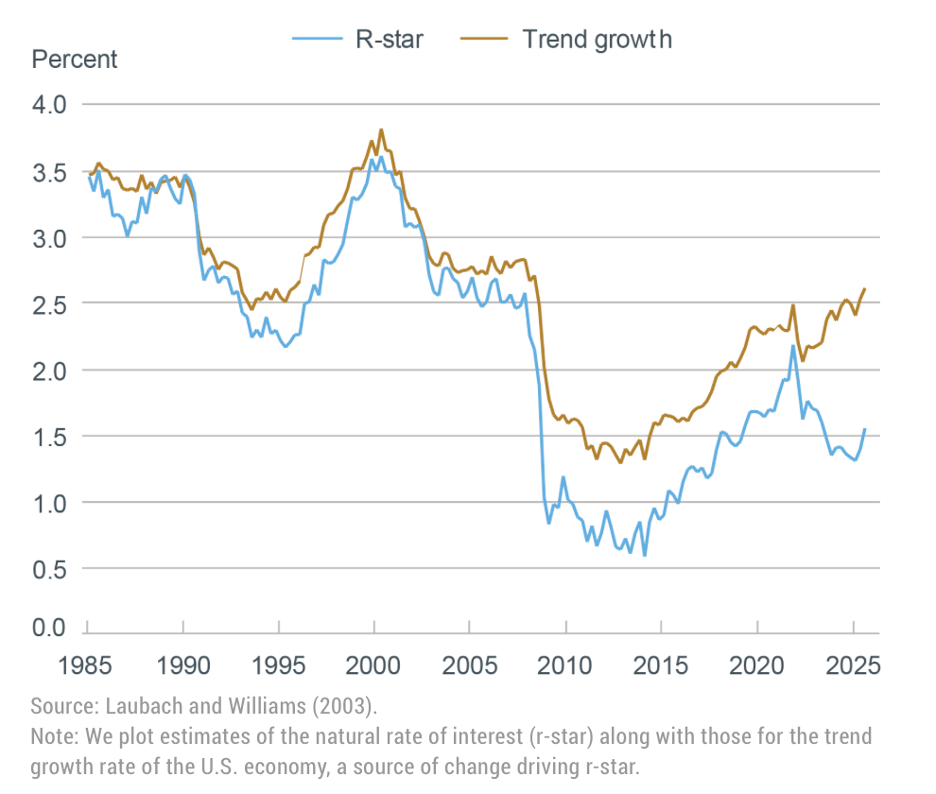
The concept of the neutral rate of interest is central to assessing the stance of monetary policy — whether policy is providing stimulus to or restraint on the economy. However, the neutral real federal funds rate is not directly observable and must be estimated. The chart below shows an estimate of the neutral real rate (R-Star) based on a prominent estimation model (the Laubach-Williams model). This model estimates that the neutral rate currently is roughly 1.5 percent, well below the 2.5 percent to 3.0 percent level that prevailed prior to the financial crisis and the COVID pandemic. The forces underlying the neutral rate—the interaction of saving behavior and the productivity of investments — suggest that the neutral rate is likely to be slow to change and not drop abruptly as in the chart. The estimated sharp drop captured by the Laubach-Williams model may have been exaggerated by the vast disruptions throughout the economy and financial system caused by the two shocks. If so, the extent by which the neutral rate exceeds the current real federal funds rate (as noted, roughly 0.8 percent) might be sizable — and current monetary policy might be quite stimulative.
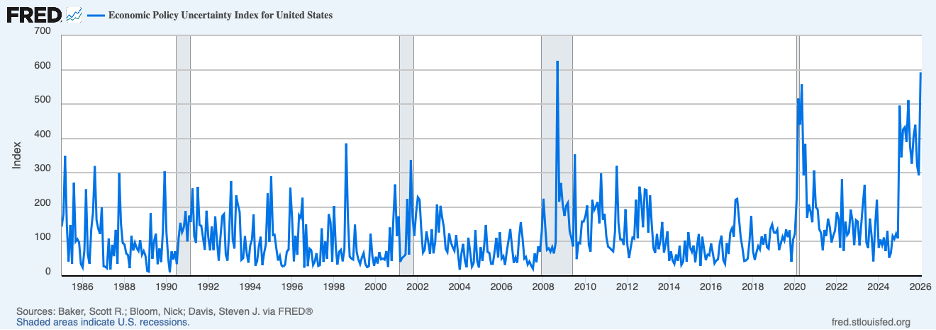
Indeed, strength in the economy in the second half of 2025 suggests that policy was not applying restraint over that period, a time when the Fed cut its policy rate three times. Growth in real GDP in the third quarter of 2025 was a robust 4.4 percent and early estimates for the fourth quarter imply another strong quarter (especially after adjusting for the lengthy federal government shutdown). Moreover, brisk growth was occurring at a time when private-sector economic decisionmakers were facing near-record levels of policy uncertainty, shown by the next chart. Such uncertainty acts to reduce and postpone investment and other spending decisions.
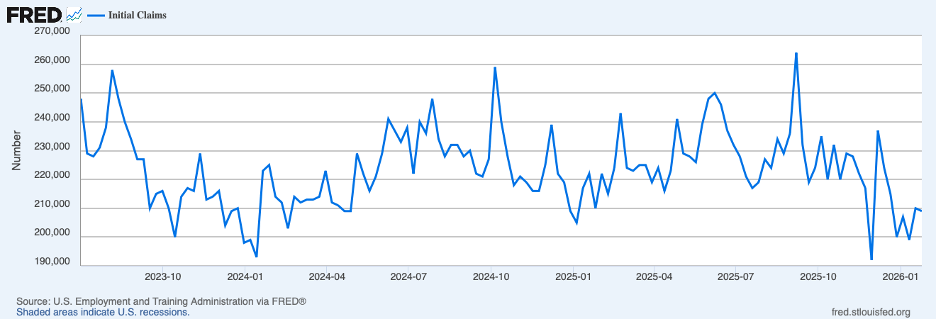
Early indications for 2026 are that the economy has begun the year on a solid footing and that brisk growth will continue. The next chart shows that initial claims for unemployment insurance continued to be quite low through much of January, implying that the labor market is holding up pretty well.
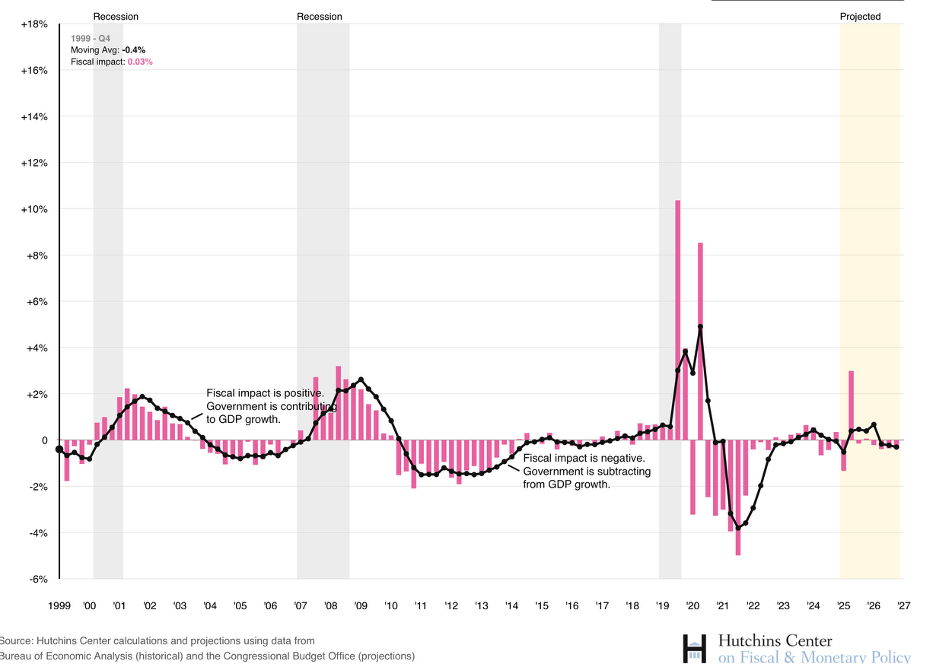
Contributing to growth this year is fiscal policy which is swinging from providing mild restraint on growth in late 2025 to providing a sizable boost in early 2026, mostly coming from the tax cuts enacted in 2025. The Hutchins Center fiscal impact measure, shown in the next chart, spikes in the first quarter of 2026.
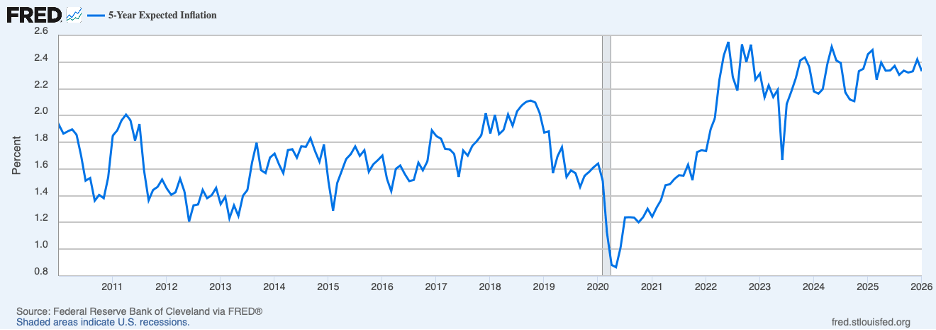
It is hard to see the economy slowing much and inflation easing much in 2026, given the current stance of monetary and fiscal policy. Moreover, new appointees to the Board in coming months will have a strong predisposition to cut rates — adding more monetary stimulus. (The weakened dollar on foreign exchange markets will also be providing stimulus and upward price pressures in the months ahead.) Furthermore, restoring price stability will require that inflation expectations by the public be aligned with the Fed’s 2 percent target, more in keeping with the period before the pandemic. The next chart, showing a five-year ahead measure of inflation expectations produced by the FRB Cleveland, indicates that inflation expectations remain stubbornly above the pre-pandemic period. In light of these various considerations, the prospects for further disinflation seem to be fading fast.
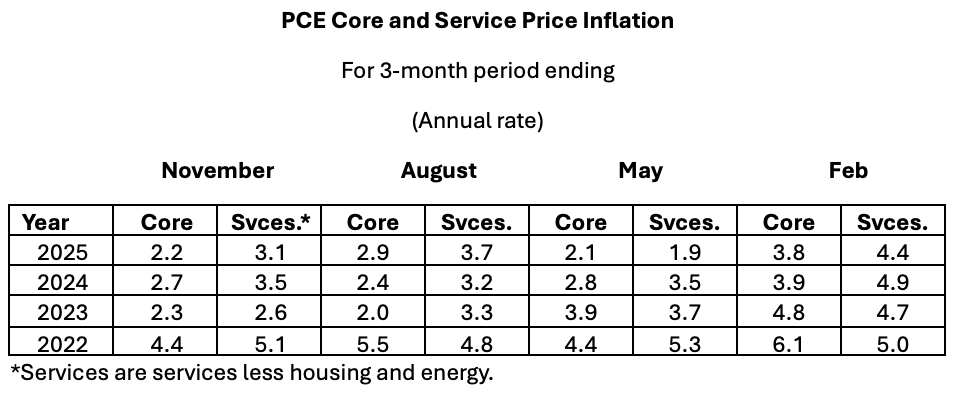
The table below shows annualized percent increases in core PCE prices for three-month intervals ending in the month shown (to the extent that seasonal adjustment methods do not remove all seasonality in the data, comparisons of three-month periods from one year to the next can shed light on trends in inflation). As shown, core inflation in the three-month period ending in November 2025 was down from a year earlier, but this drop reversed an increase in the three-month period ending in August, implying little deceleration in core PCE prices, on balance, over the second half or more of 2025.
Chair Powell has argued that measured inflation would have been lower — and closer to the 2 percent target — had tariffs not increased appreciably in 2025 and if the imputed prices of some services entering the indexes were more representative of actual transaction prices also included in the indexes. Some items entering the PCE index do not have explicit transaction prices—including services from owner-occupied houses and certain financial services — and must be imputed by the agency producing the data (Bureau of Economic Analysis).
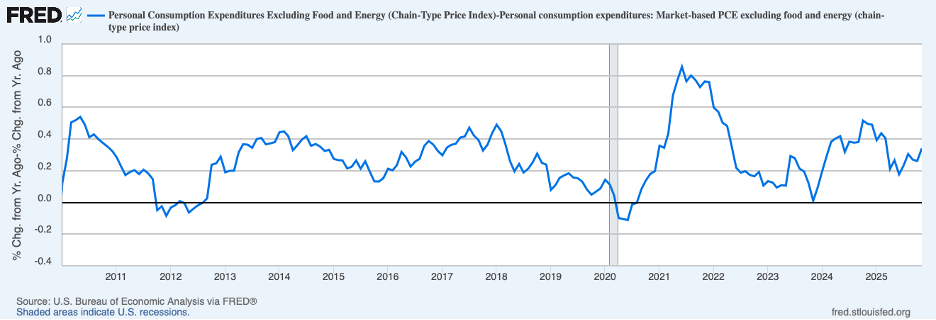
Measured core PCE inflation regularly exceeds an alternative market-based measure by an average of 0.3 percent, next chart. Of note, the gap between the core PCE inflation and the market-based measure narrowed 0.2 percentage points between November 2024 and November 2025 as the market-based measure slowed only 0.1 percent. (In assessing trends, such as the extent of disinflation, changes in the gap are relevant and not the level of the gap.)
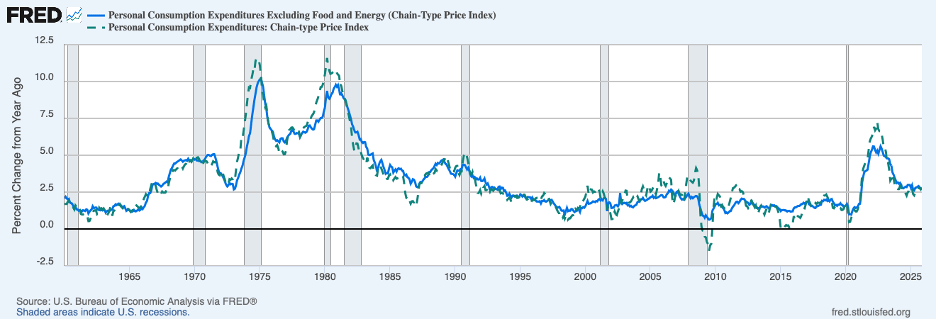
Chair Powell has expressed the view that tariffs, affecting goods prices, are likely to have a near-term but not a persistent effect on inflation (raising the level of consumer prices but not the ongoing rate of inflation). Spending on goods accounts for one-third of total consumer spending. The chart below, showing the twelve-month percent change in goods prices (the broken green line), illustrates that an upturn began in the latter part of 2024, several months before new tariffs went into effect (some of that upturn might have reflected expectations of tariffs but goods prices clearly had already been returning to a pattern of increases following major supply-chain disruptions in previous years). The increase in goods prices over the twelve months ending in November was 1.4 percent. This increase exceeds the 0.2 percent annual rate of increase over the decade prior to the 2020 COVID pandemic. However, it seems likely that the underlying increase in goods prices was exceeding the pre-pandemic rate even before higher tariffs, and thus not all the recent increase in goods prices can be attributed to tariffs.
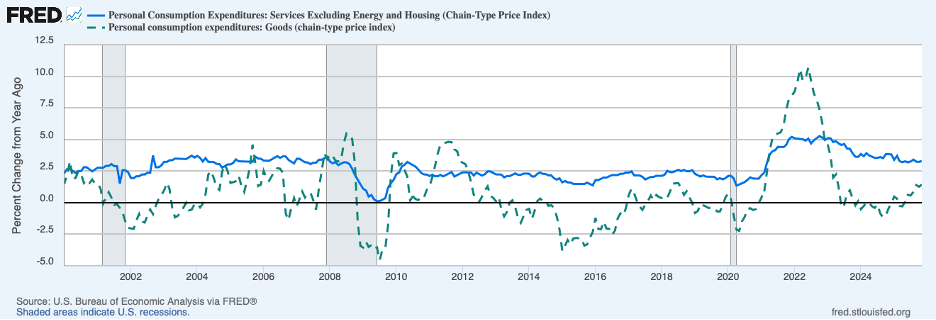
A better indicator of underlying inflation than the core PCE measure at a time when goods prices (and housing service prices) are being affected by unusual forces are service prices other than housing and energy, the solid blue line in the chart. These prices rose 3.3 percent over the twelve months ending in November, up slightly from October. The above table shows a deceleration in service prices in the three months ending in November from a year earlier, but that only offset a pickup in the previous three-month period ending in August, suggesting little deceleration over the latter part of 2025. Thus, the evidence on underlying inflation indicates that inflation slowed somewhat from 2024 to 2025 but that slowing does not seem to have continued over the second half of the year.

Header image: Markus Winkler / Unsplash
