
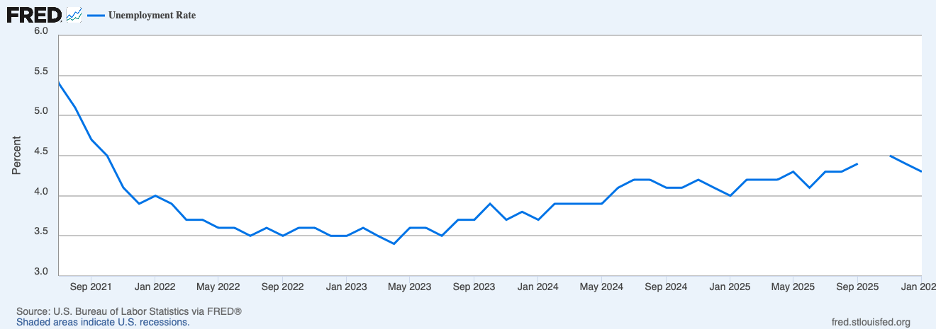
The Fed’s dual mandate is maximum employment and stable prices. Calibrating the maximum level of employment is not simple, but the Fed and other analysts tend to use the unemployment rate as the primary indicator of employment conditions. The consensus is that the level of the unemployment rate consistent with maximum employment is in the vicinity of 4-1/4 percent. The Fed deems stable prices to be a 2 percent annual increase in the Personal Consumption Expenditures (PCE) index.
The chart below shows that the unemployment rate in January returned to the 4.3 percent area in January, following a couple months above that level. January was also a month in which there was a large increase in private sector employment, shown in the next chart.
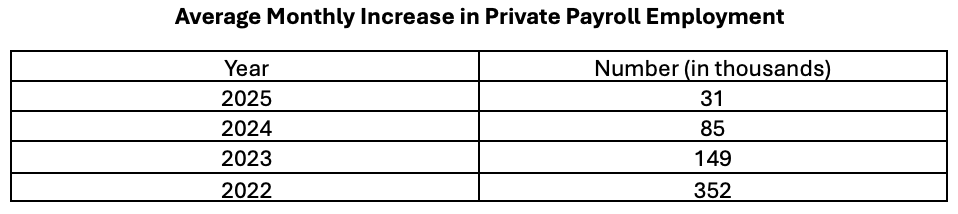
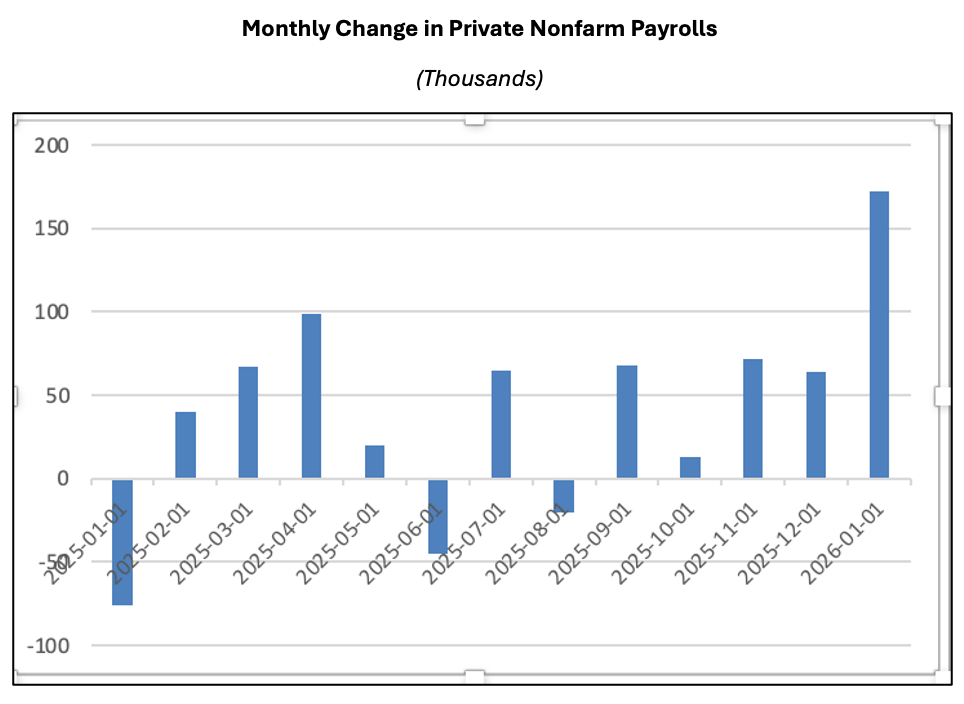
Private-sector employment rose 172 thousand in January after averaging only 31 thousand per month in 2025. Average monthly employment gains had been slowing since 2022, as seen in the table below.
The slowing in 2024 and 2025 owed importantly to a major shift in immigration policy. As the number of entrants to the labor force has slowed dramatically, the break-even increase in employment — the increase required to absorb entrants and keep the unemployment rate unchanged — has fallen. The break-even increase currently is below 50 thousand, down markedly from the break-even increase of around 100 thousand before the pandemic and subsequent immigration surge.
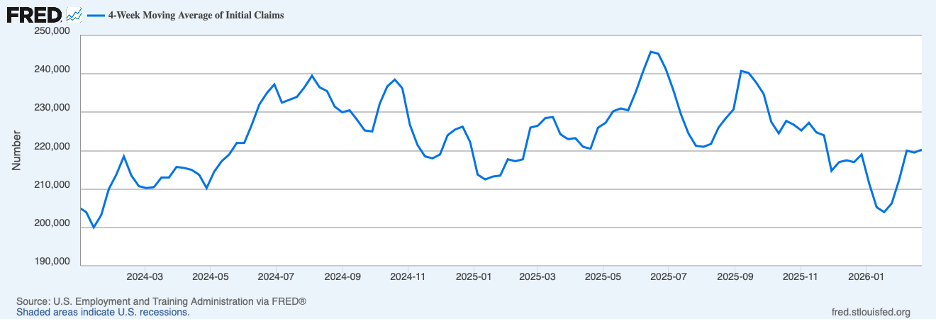
In view of the general slowing of workers into the labor force, the January spike in employment was remarkable. Moreover, initial claims for unemployment insurance, shown in the next chart, remained low through the latter part of February, suggesting that the economy stayed near maximum employment last month.
Turning to prices, headline CPI inflation slowed to 2.4 percent over the twelve months ending in January and core CPI inflation to 2.5 percent, table below. Both measures are well below a year earlier, though still above the Fed’s 2 percent target.
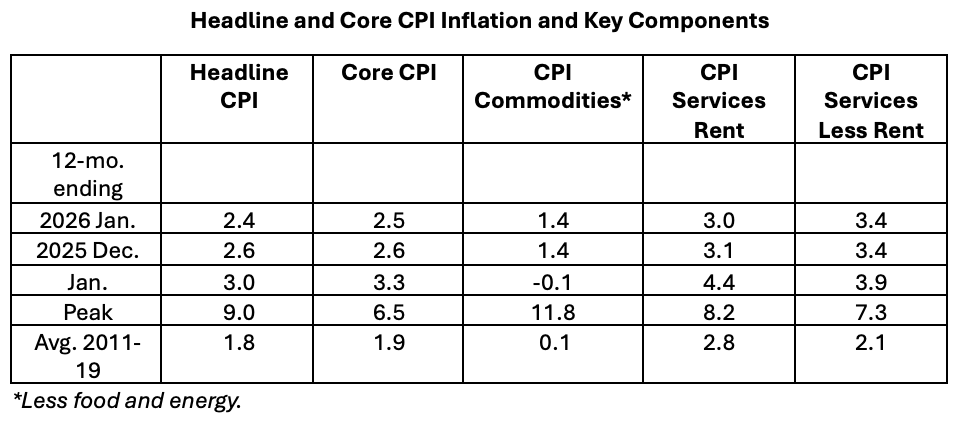
Both headline and core measures of inflation have been affected by disruptions caused by tariffs and extraordinary factors impacting shelter costs. The primary impact of tariffs has been on prices of commodities. Core commodity prices rose 1.4 percent over the twelve months ending in January, an appreciable pickup from a year ago. Much of that pickup can be attributed to new tariffs which are not expected to have much lasting impact on inflation. Nonetheless, it is likely that this component, once tariff-effects have played out, will continue to rise more rapidly than it did in the decade prior to the COVID shock in 2020. Shelter costs have been a major contributor to measures of consumer price inflation in recent years — boosted by the immigration surge — but have since slowed appreciably.
Less affected by the disruptions affecting commodity and shelter prices have been service prices less rent of shelter, the last column in the table above. Such service prices have risen 3.4 percent over the past year, down from the 3.9 percent twelve-month increase a year ago. However, the recent increase is still more than one percentage point above the average annual increase over the 2011 to 2019 period.
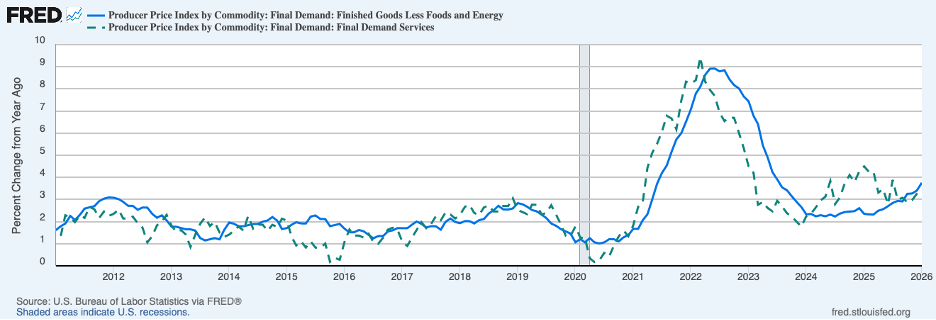
A different angle on underlying inflation can be gained by examining producer prices at the final demand level (chart below). Twelve-month changes in core finished goods are shown by the solid blue line and services by the broken green line in the chart. Both turned up in January — finished goods prices to 3.8 percent — in part, owing to tariffs — and service prices to 3.4 percent. The twelve-month increases are well above the average increases over the decade prior to the pandemic — 2.0 percent for core finished goods and 1.8 percent for services.
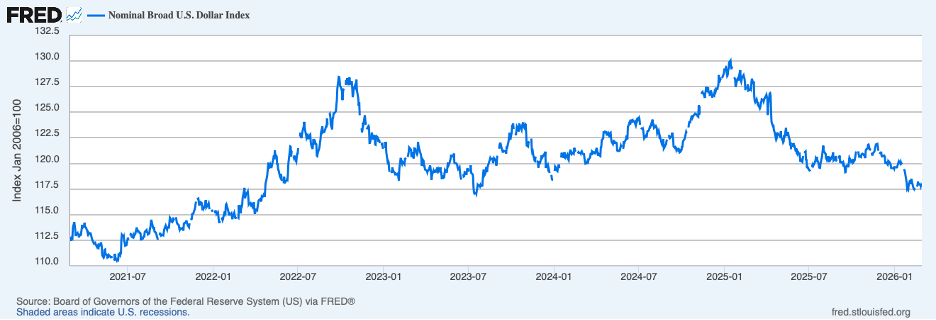
The weakening dollar on the foreign exchange market, the next chart, has been and will continue to push up consumer prices, especially commodity prices.
The above evidence on inflation suggests that underlying inflation continues to be stubbornly high and momentum persists. Should economic growth continue to be brisk — exceed the rate of growth of potential output or the rate consistent with no change in unemployment or the inflation rate — it is hard to see how underlying inflation can move lower.
The rate of growth of potential output is not directly observable but must be inferred from its two principal components — growth in labor input and growth in labor productivity. Both components have undergone significant change recently, labor input by the halt in immigration and productivity by the burst in innovation (notably AI). A reasonable estimate of growth in potential output is 2-1/4 percent per year — 1/4 percent growth in labor input plus 2 percent growth in productivity.
Output growth in 2025 was close to growth in potential, 2.2 percent, held down by the government shutdown in the fourth quarter. However, adjusting for the shutdown, growth was 2.5 percent for the full year and 3.4 percent over the second half. Moreover, the FRB Atlanta in its most recent GDP Now forecast has growth in the first quarter of this year at a 3.0 percent annual rate. These rates of growth are indicative of considerable monetary and fiscal stimulus giving the economy a boost that is adding to pressures on resources. In these circumstances, it would seem that disinflation does not have much of a chance and a soft landing is not in prospect.
Header image: Brad Knight / Unsplash
