
Policymakers and analysts are emphasizing that another supply shock—a surge in oil prices—is about to hit measures of consumer inflation at a time when the full impact of the last supply shock—higher tariffs—has yet to be realized. As a result, the time required before the Fed hits its 2 percent target for PCE inflation might be pushed out again.
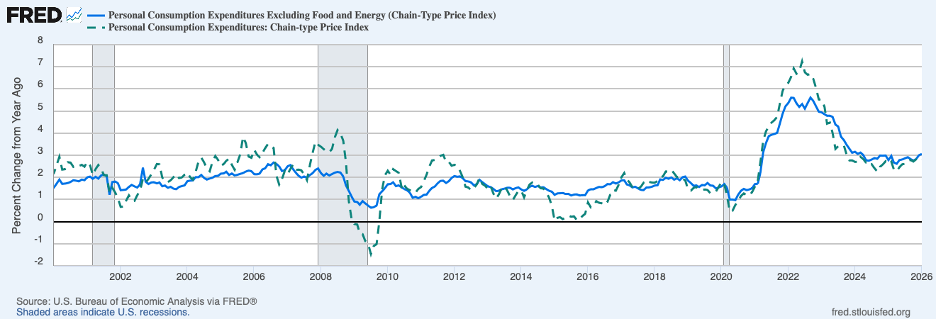
The chart below shows that headline PCE prices rose 2.8 percent in January (most recent data), while core PCE prices rose 3.1 percent. Both measures were above the readings of a year earlier—headline PCE 2.6 percent and core PCE 2.8 percent.
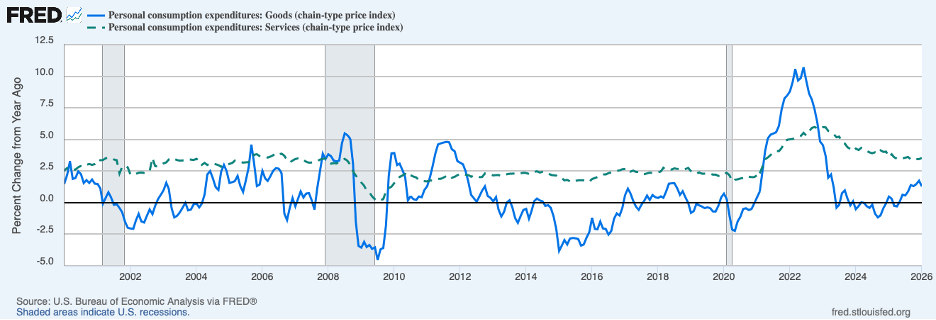
Higher tariffs have been pushing up prices of goods, as shown by the solid blue line in the next chart. It is likely that much, but not all, of the upturn in goods prices since early 2025 can be attributed to tariffs. Inflation in PCE service prices, the broken green line, has persistently run about one percentage point above the decade prior to the COVID shock and has shown little tendency to moderate over the past year.
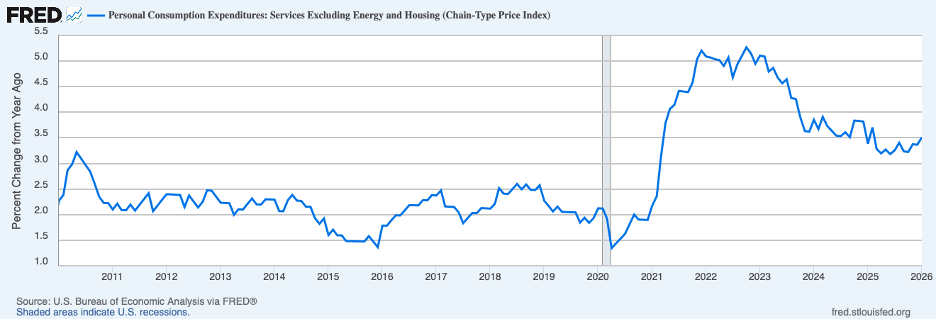
Concern has been expressed about whether the service component of the PCE index may be distorted by housing costs which appear in service prices and have not tracked closely with other measures of housing costs. The next chart shows service prices with housing (and energy) costs removed. In current circumstances, this measure of service prices can be viewed as a reasonably good indicator of underlying inflation. This measure of service prices is telling the same basic inflation story as overall service prices—service price inflation appears to be stuck around one percentage point above the pace prior to the pandemic.
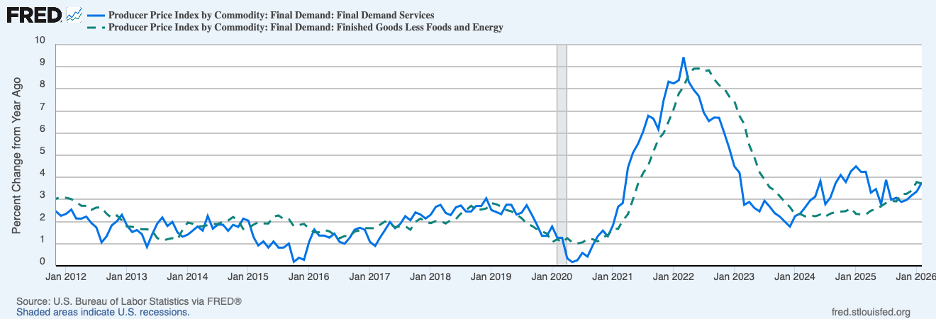
Turning to producer prices, the next chart shows the twelve-month percent change in final demand services and final demand goods through February—the solid blue and dotted green lines, respectively. Both have been on an upswing in recent months—to 3.8 percent for services in February and to 3.7 percent for goods. These increases are well above the average for the period prior to 2020—1.8 percent for services and 2.0 percent for goods.
In sum, the recent news on inflation has not been favorable—underlying inflation remains stubbornly above the Fed’s 2 percent target. It has been tempting to point to observable one-off factors, such as supply-chain disruptions as well as increases in tariffs and energy shocks, to explain the continuation of high inflation over the past several years. But doing so runs the risk of overlooking other factors, less observable, that have been contributing to the persistence of inflation. The dynamics of the inflation process are only partially understood. Historical experience shows that, in times of elevated inflation, there is something else at work beyond the forces we can easily identify that contribute to this persistence.
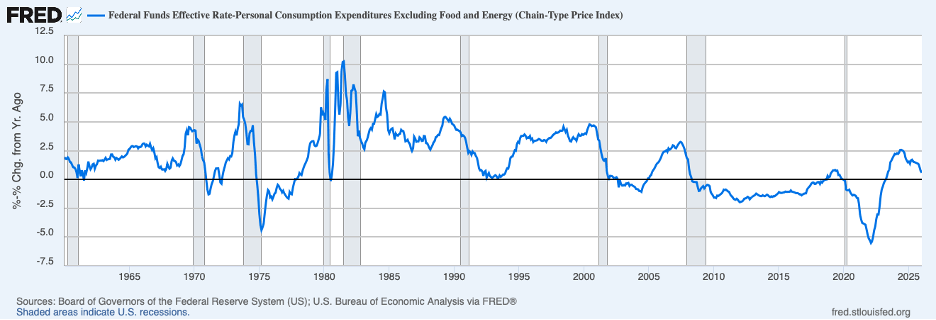
Fed policy currently appears to be stimulative. The chart below presents a measure of the real federal funds rate (the effective nominal rate less the twelve-month percent change in the core PCE) through January. In January, it stood at 0.6 percent, which is nearly one percentage point below the estimate of 1.5 percent from one of the more commonly followed models of neutral real federal funds rate (the Williams-Laubach model produced at the FRB NY).
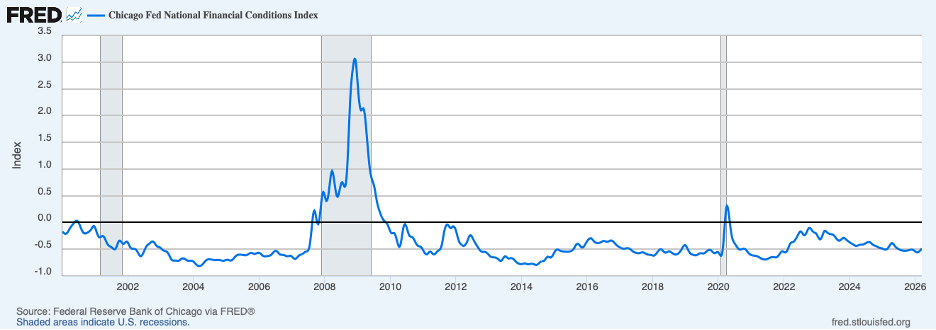
Broader financial conditions are also providing considerable stimulus (the next chart). Stimulative monetary policy and financial conditions more broadly are being accompanied by very stimulative fiscal policy in early 2026 and the combination will be making it difficult to see relief on the inflation front anytime soon (especially with ongoing intense political pressures on the Fed to ease policy).
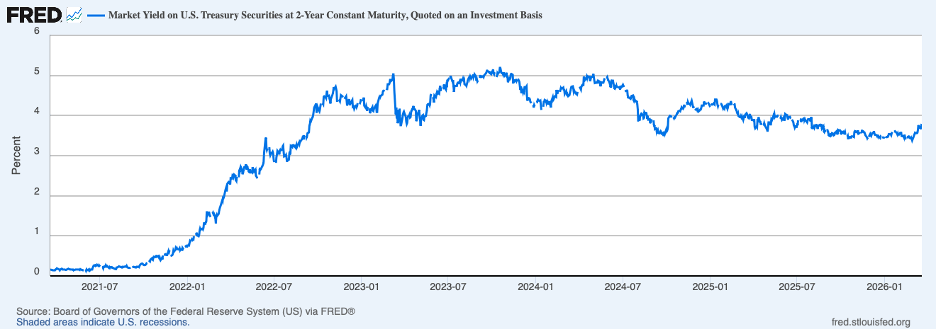
Market participants appear to be taking a more sober view of the outlook for monetary policy. The chart below shows the yield on the two-year Treasury note which represents the average federal funds rate expected by market participants over the coming two years. This rate has turned higher recently. At 3.8 percent most recently, market participants no longer are convinced that the next rate move by the Fed will be downward and foresee that it might be upward. This outlook appears to be remarkable in light of forthcoming political pressures on the Fed to lower rates.
Header image: Nathan Cima / Unsplash
