
A growing chorus of analysts has been reading recent economic news–especially consumer prices–to be suggesting that the economy is on a glide path to a soft landing—inflation returning to the pre-pandemic pace while avoiding a recession. This soft-landing scenario implies that little or no further Fed tightening will be needed. Indeed, federal funds futures prices envision only a tiny likelihood of another 25-basis point hike before year-end and a good chance that the Fed will begin reversing rate hikes before mid-2024. This rosy outlook has been fueling the recent stock price run-up.
But are there good reasons to believe that soft landing advocates have gotten ahead of their skis?
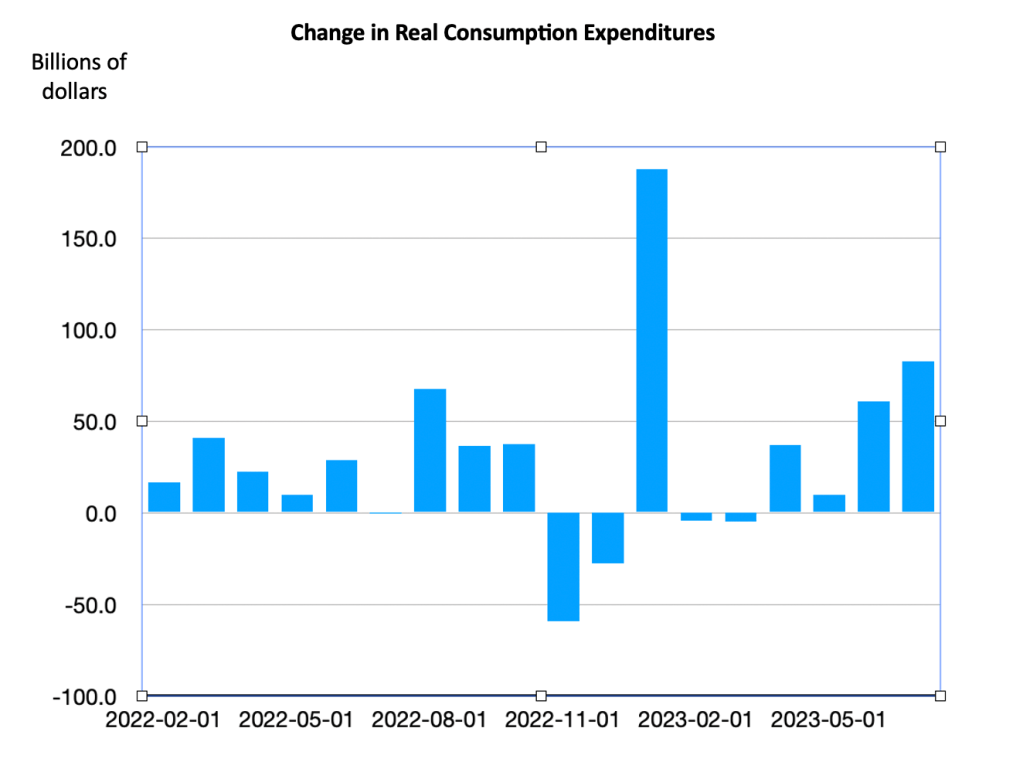
First, there appears to be a recent firming in aggregate demand, leading to growth in output exceeding the maximum sustainable rate of around 2 percent annually. A pickup in output growth in the third quarter is likely to bring growth over the first three quarters of this year up to 3 percent or higher. Pacing growth in output has been consumption, shown in the chart below. The increase in consumption spending in June and July, the last two bars, was among the strongest since early 2022.
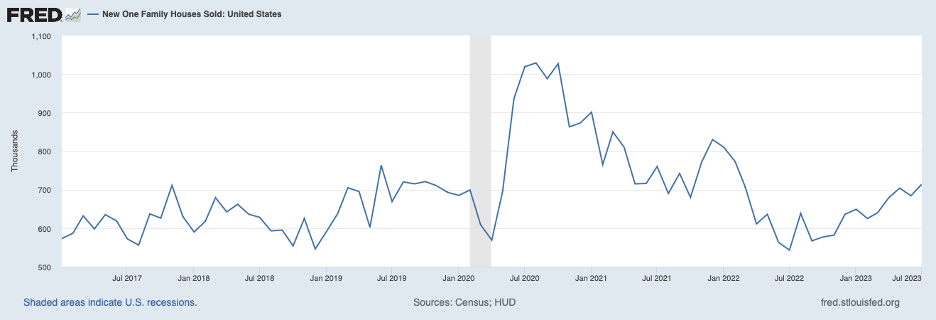
Also providing impetus has been residential construction and sales of new homes, shown in the chart below. The housing sector, which typically weakens more than other sectors in response to monetary restraint, took a dip once the Fed began to tighten policy in early 2022 but has been on an upswing in recent months, returning to pre-COVID levels.
Firming housing demand can also be seen in home prices, shown next for existing homes. After soaring during the pandemic, home prices decreased once the Fed was in the early stages of tightening.
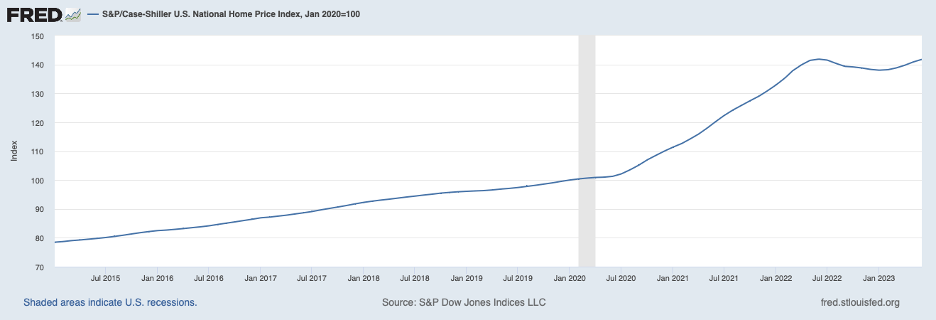
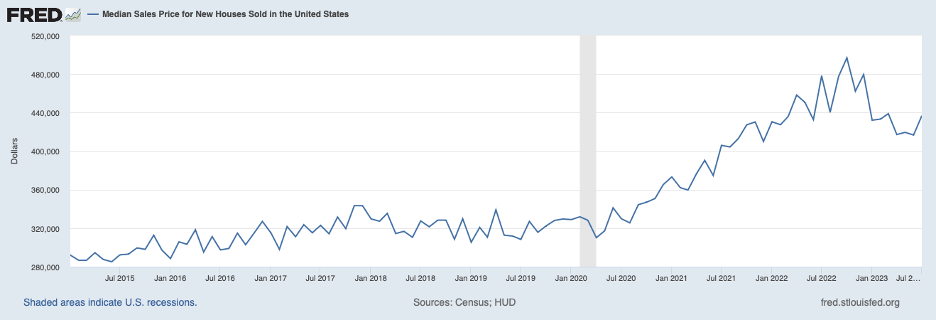
However, home prices have resumed increasing at a solid pace of late. A similar pattern is visible in the median price of new homes, shown below.
Beyond consumption and housing, retail inventories remain very lean, as shown by the retail inventory-to-sales ratio in the following chart.

Retailers are likely to continue to work to restock shelves, which will add to suppliers’ order books and pressure on resources. The above discussion implies that there is unsustainable momentum in aggregate demand and that aggregate demand will need to slow if overheating is to be fully countered and inflation is to return to pre-pandemic rates.
A second reason for caution about inflation being tamed is the ongoing imbalance in the labor market. The following chart shows the excess of job openings over the number of unemployed persons, which is still extraordinarily large through July (most recent data for job openings). While this excess has been shrinking, it remains rather large.
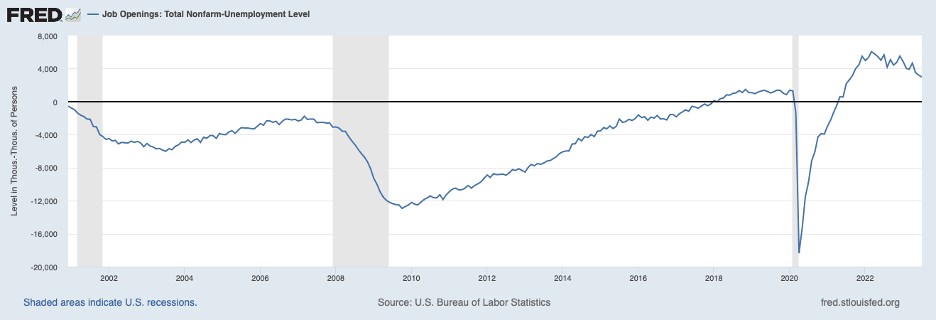
Furthermore, the August increase in payroll employment—187,000—surpassed the sustainable increase—which is on the order of 100,000 monthly—by a sizable margin. The increase in the unemployment rate from 3.5 to 3.8 percent is wholly attributable to an increase in the labor force participation rate—adults coming off the sidelines in response to the favorable labor market.
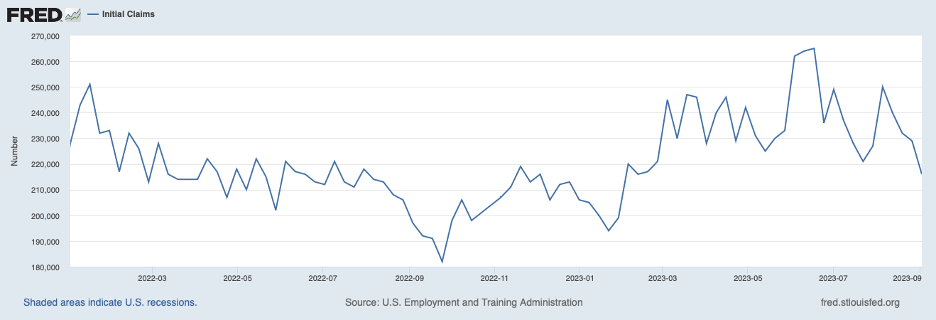
The tight labor market extended into early September based on weekly initial claims for unemployment insurance, shown in the following chart. Weekly claims have fallen in recent weeks to very low levels by historical standards.
As seen in the chart below, imbalances in the labor market are placing pressure on wage growth. Based on the Atlanta Fed’s Wage Growth Tracker series, growth in average hourly earnings has slowed somewhat but remains well above the pre-pandemic rate. Moreover, it is unclear how much additional wage deceleration can be expected while the labor market stays brisk.

Further cautionary evidence comes from recent consumer price data.
The following chart shows headline PCE inflation (the blue line) and core PCE inflation (which excludes volatile food and energy prices, the red line). Headline inflation has fallen substantially from its peak but will rise in the coming months due to the recent jump in energy prices. Core prices rose 4.2 percent over the twelve months ending in July, although the increase over the three months ending in July was 2.9 percent at an annual rate. It is instructive to break down PCE inflation into its services and goods components, shown next.

Goods prices (the red line) have fallen recently, reflecting an unwinding of supply chain disruptions, while service prices have continued to rise at roughly double the rate before the pandemic.
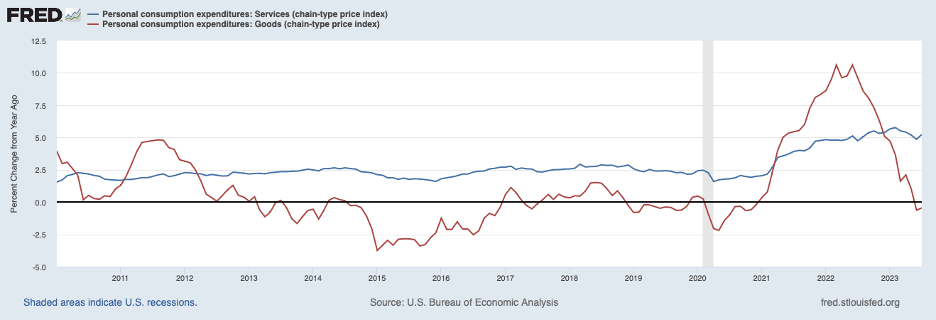
Looking ahead, goods prices can be expected to stop declining and resume increasing. In contrast, service price inflation can be expected to slow as its rent component—which has been an important contributor to the large increases in service prices—moderates. At issue is which of these two forces will be stronger—will the upturn in goods prices dominate the slowdown in service prices or the reverse?
Given the momentum in aggregate demand discussed above and the ongoing tightness in the labor market, it seems very likely that both goods and service prices will rise at rates that exceed the pre-COVID period and that overall inflation will continue to rise above the Fed’s 2 percent target. In other words, this episode of high inflation can be expected to show again that it is stubborn to tame once it takes hold. If inflation remains stubborn, more monetary restraint will be needed from the Fed, and the prospects for a soft landing will start to fade. More monetary restraint will not be greeted very enthusiastically by the bond and stock markets.
