
Economic growth over the second half of 2023 was brisk. Real GDP expanded at a 4 percent annual rate over the second half of 2023, up from a 2 percent rate in the first half and only ¾ percent over all of 2022. Moreover, initial claims for unemployment insurance thus far in January are not pointing to a slowdown in economic activity in early 2024. Growth at a 4 percent rate is unsustainable, especially if the Fed is going to make further progress in bringing down inflation to its target of 2 percent.
To achieve its target for inflation the Fed raised the federal funds rate from nearly zero in March 2022 to a little above 5-1/4 percent most recently. The increase in the federal funds rate is shown by the blue line in the chart below.
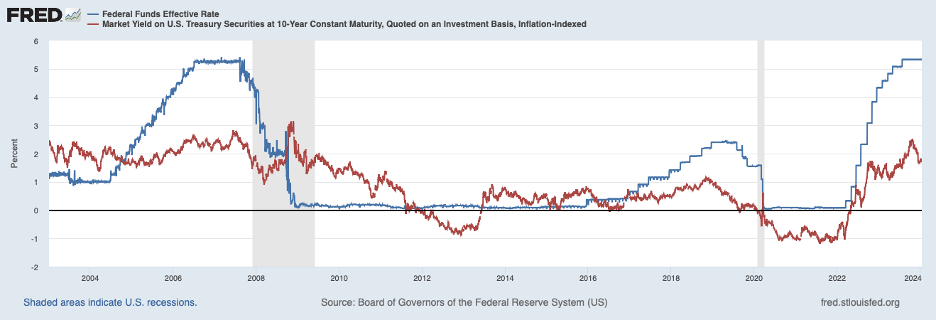
Accompanying the more restrictive stance of Fed policy has been an increase in longer-term interest rates which have a more significant impact on business and consumer spending than short-term rates. Shown by the red line in the chart above, the real interest rate on the inflation-indexed, ten-year Treasury note (a measure of the long-term real interest rate) increased about 270 basis points (100 basis points equals one percentage point) since the Fed began tightening—from minus 90 basis points to 1.8 percent most recently. But the current real long-term interest rate level is not particularly restrictive judged by its level in earlier periods.
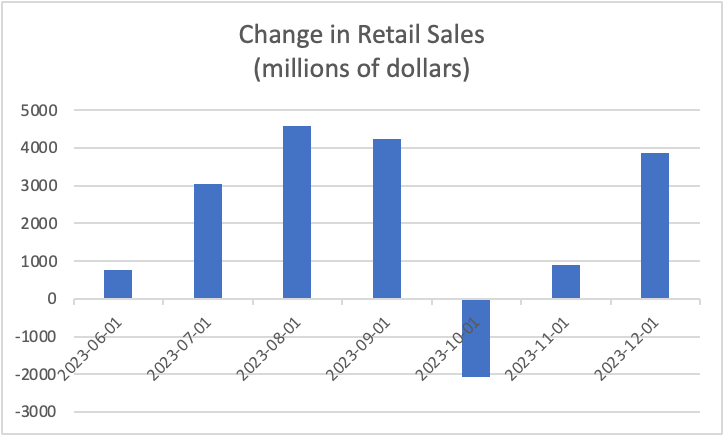
Buoyant consumer spending has been an important contributor to growth in the second half of last year (the bar chart below) and the retail sales data for December indicate that consumer spending ended 2023 on a solid note.
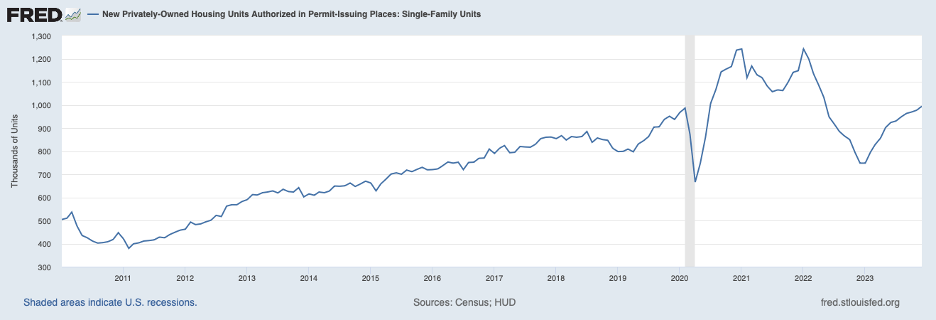
Elsewhere, residential construction activity has continued to firm, as shown by permits for single-family homes in the chart below. Residential construction expanded in the third quarter of last year for the first time in nine quarters and expanded again in the fourth quarter. Thus, the Fed’s restrictive policy is not sufficiently restraining consumer and housing spending to cool the economy and return inflation to 2 percent.
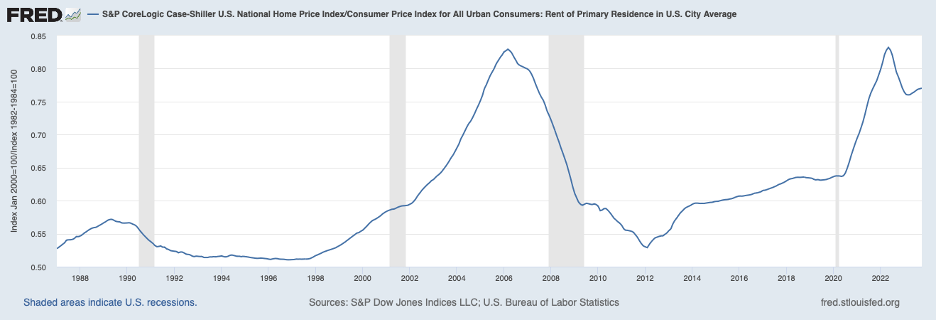
The strength in demand for housing is putting upward pressure on home prices, including home prices in relation to rent. The following chart shows that home prices in relation to rent have been on an upswing in recent months and are at a historically high level. The high ratio of home prices to rent is especially noteworthy in the context of relatively high mortgage and other interest rates.
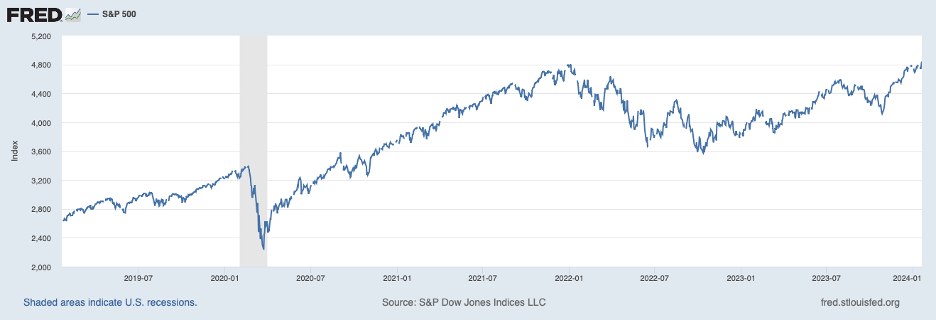
The implied runup in the value of home equity from the increase in home prices is giving a lift to consumer spending, as is the elevated stock market shown in the following chart. The chart illustrates that the S&P 500 has been touching new highs (as has the Nasdaq index representing tech stocks).
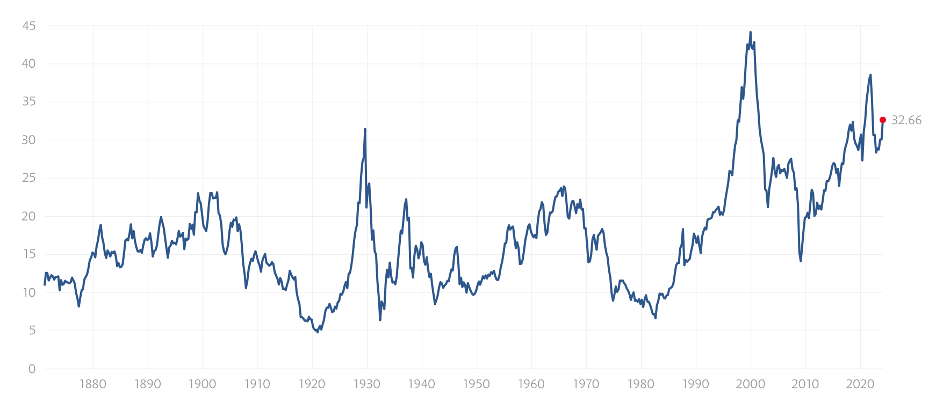
The following chart shows that the increase in share prices is lifting the cyclically adjusted price-earnings ratio (an analog to the home price-rent ratio for housing asset values) further into the upper range of historical experience despite the monetary restraint that the Fed has applied. Both the ratio for housing and stocks raise the question of whether Fed policy is stringent enough. These elevated ratios also point to a vulnerability in the form of a downward correction in home and equity prices.
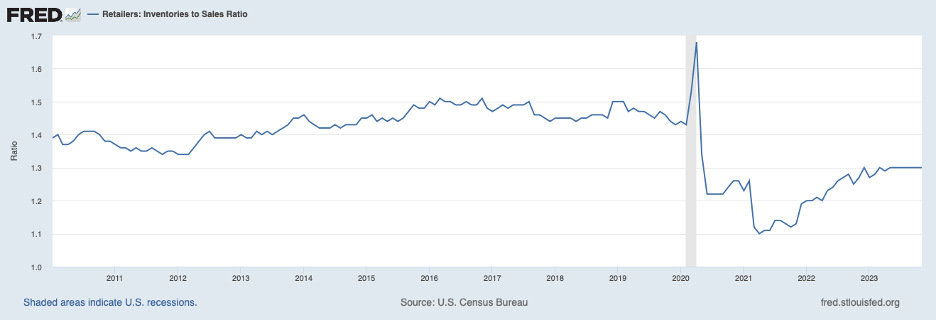
Looking ahead, efforts by businesses to rebuild inventory positions will boost aggregate demand and add to pressures on resources. The next chart contains the retail inventory-to-sales ratio through November. It shows that inventory positions remain lean, and businesses have a rebuilding job ahead before inventory stocks get realigned with sales. Nonfarm inventory investment added 1-1/4 percentage points to real GDP growth in the third quarter and a bit more in the fourth quarter of last year, but as the chart shows, that did little to boost retail inventory stocks in relation to sales.
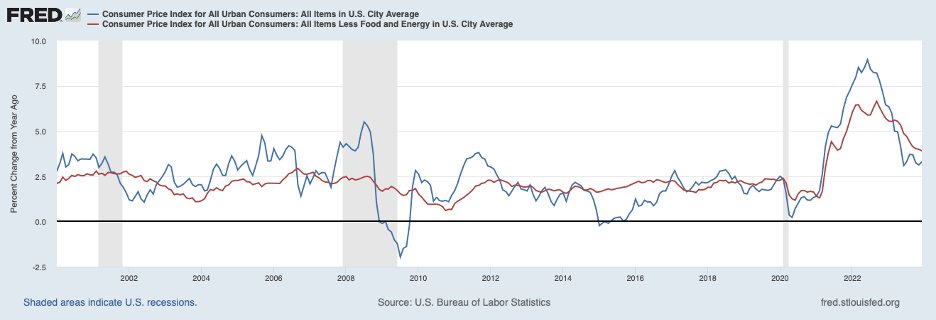
Turning to inflation, headline CPI inflation picked up to 0.3 percent in December while core CPI inflation stayed at 0.3 percent. Over the year 2023, headline inflation was 3.4 percent, the blue line in the chart below, and core inflation was 3.9 percent, the red line. Some observers have been encouraged by price increases over the most recent three months—1.8 percent at an annual rate for the headline CPI and 3.3 percent at an annual rate for the core CPI—which might suggest further disinflation in the months ahead.
However, looking under the CPI hood, two important components of the core CPI may be giving reason for pause. The first CPI component is the prices of commodities (less food and energy). These prices were flat in December after six months of declines which helped to hold down the CPI over that period. The declines reflected an unwinding of supply-chain disruptions. The chart below indicates this unwinding has come to an end, and a more normal supply chain situation has been restored.
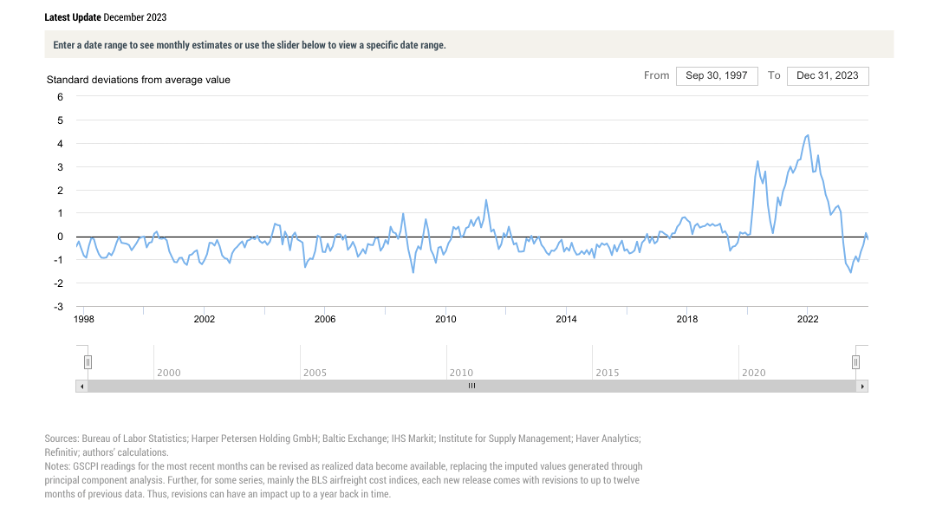
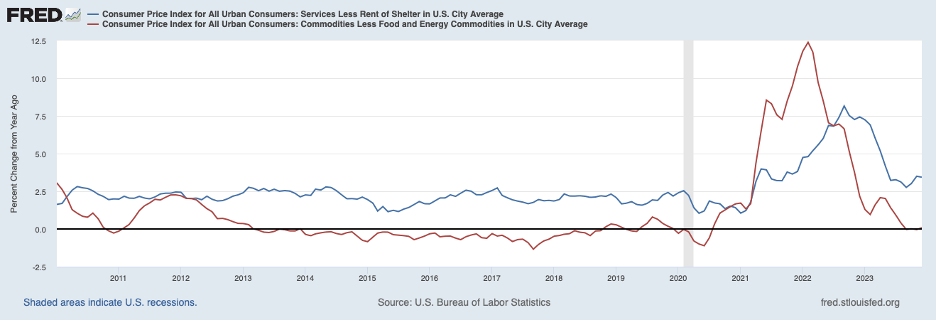
The red line in the next chart below shows that commodity prices were unchanged over the twelve-month period ending in December as declines over most of the second half of the year offset increases over the first half. This disparity in commodity price movements reflect supply chain swings. Looking ahead, we can no longer expect commodity prices to be on a sustained decline and to hold down consumer price inflation.
The second CPI component is service prices (less rent of shelter), shown by the blue line in the chart below. Service prices rose 3.4 percent over the twelve months ending in December but stepped up to 0.6 percent in December following a similar large increase in November.
The pickup in service prices over recent months is worrisome. It may be suggesting that the process of disinflation may be coming to an end at a time when underlying inflation is one percentage point or more above the Fed’s 2 percent target.
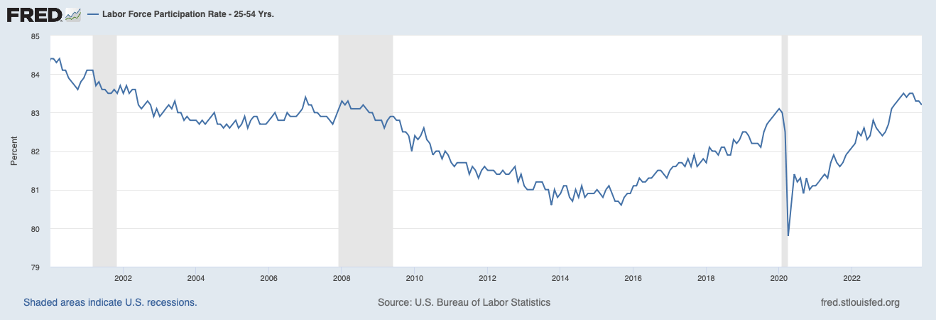
Inflation has fallen over the past year in part owing to an easing of supply-chain pressures as already noted. The disinflation process has also benefited from an increase in labor force participation by prime-age workers, shown in the following chart, which enabled producers to augment supply. However, labor force participation has declined over the past three months.
If the disinflation process stalls out, the Fed’s scope for lowering the federal funds rate will be constrained. Currently, market participants expect the Fed to start lowering the federal funds rate by May and to continue to lower the rate over 2024 by a cumulative 125 to 150 basis points. This expectation of rate cuts over 2024 seems to be based on an outlook of ongoing declines in underlying inflation.
In contrast, recent data suggest that the road ahead may have more bumps than built into current market prices. Continued brisk growth in demand and constraints on supply suggest that further disinflation may not be forthcoming in the period ahead. Accordingly, the Fed may need to hold a restrictive stance for longer. If so, a correction in asset prices—including equity and real estate prices—could be on the horizon.
