
The release of CPI for January again dashed optimism for continued disinflation and near-term rate declines by the Fed. Now, market participants foresee the Fed’s first cut in rates coming around mid-year instead of the spring and the cumulative cut in rates of 75 to 100 basis points in 2024 (100 basis points equal one percentage point) instead of the expectation of 125 basis points just a couple weeks ago. Are these expectations reasonable or are market participants still overly optimistic?
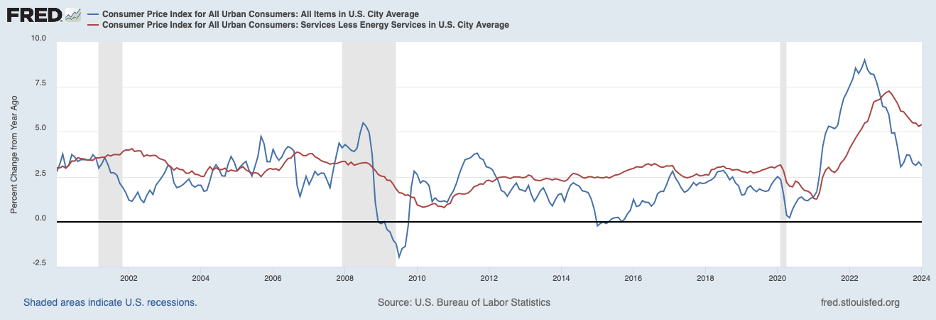
The chart below plots twelve-month headline inflation (blue line) and core inflation (red line). Headline CPI rose 3.1 percent in January, down from 6.4 percent a year earlier. Core CPI (which excludes volatile food and energy prices) rose 3.9 percent over those twelve months and has not shown much deceleration over recent months. Indeed, the core CPI rose at a 3.9 percent annual rate over the three months ending in December, as shown in the table (below the chart), suggesting no further deceleration in core prices.
We can get a better picture of underlying inflation by breaking down core prices into prices of commodities (excluding food and energy) and services (excluding rent of shelter). Together, these two components of the CPI account for nearly half of consumer outlays. The services component excludes rent of shelter on the grounds that some have argued that the rent component may be overstating underlying rent increases based on other information that points to a slowdown in rent inflation. However, CPI data on the rent component has yet to show the slowdown that was anticipated.
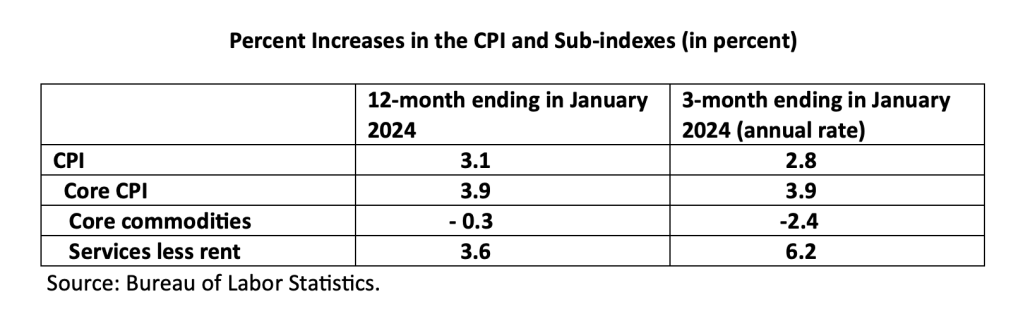
The level of core commodity prices registered a slight decline over the twelve months ending in January (as shown in the table above) but a faster rate of decline over recent months. Core commodity prices have been buffeted by supply-chain disruptions during the COVID period, surging initially and then reversing those increases, as indicated by the blue line in the chart below. The 2.4 percent rate of decline over recent months suggests that all of the unwinding of supply-chain effects may not have been completed judging from the 0.2 percent average rate of increase over the decade before COVID. In other words, we can expect the decline in commodity prices to slow in the months ahead and to hold down the CPI to a lesser extent than in recent months.
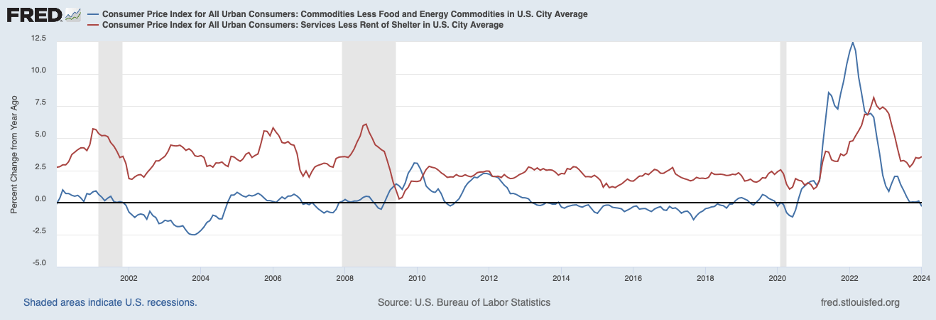
Given the cross-currents affecting the commodity component of the CPI, the services component likely is a better indicator of underlying consumer price inflation. The CPI component for services excluding rent is shown by the last line in the table above and the red line in the chart above. The chart shows that the twelve-month increase in service prices has been ticking up over recent months to 3.6 percent in January. Indeed, the increase over the three months ending in January was 6.2 percent annually. Worrisome is that the three-month increase in this component for the period ending last October was only 2.9 percent at an annual rate. (It is worth noting that there are pitfalls to focusing on just a few categories of services that show large increases in a particular month—such as hospital services— and writing them off as one-off catchups. Increases in prices across different categories of services—or commodities, for that matter—tend to be lumpy and not uniform on a monthly basis. This breakdown implies that underlying inflation does not appear to be declining as market participants have come to believe—and could even be turning upward. (Producer Price Index data for January are broadly consistent with the interpretation of CPI data presented above.)
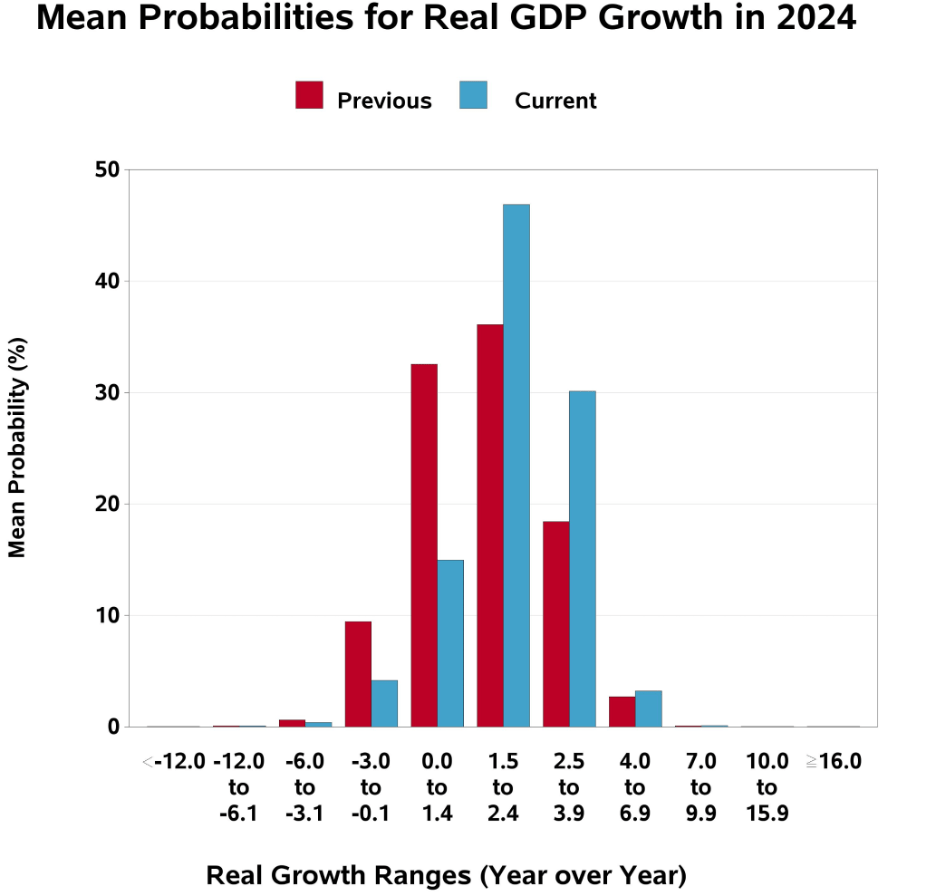
The above reading of recent inflation data is consistent with growth in output. A strengthening of growth in the second half of 2023 brought growth for the year up to 3.1 percent—a good bit above the sustainable rate of growth of nearly 2 percent. Moreover, available data for the first quarter of this year are pointing to growth in excess of 2.5 percent according to a closely followed model forecast prepared by the Federal Reserve Bank of Atlanta. (A lot of attention has been given to the drop in retail sales in January. However, retail sales around year-end need to be interpreted carefully because seasonal patterns have been shifting around year-end. In particular, the growing use of gift cards and certificates is changing actual spending patterns and methods of adjusting for seasonal variation have yet to catch up.) Indeed, professional forecasters are revising upward their forecasts for growth in 2024, as shown in the following chart. These forecasters now foresee growth in real GDP of 2.4 percent in 2024, up from their 1.7 percent forecast last November.
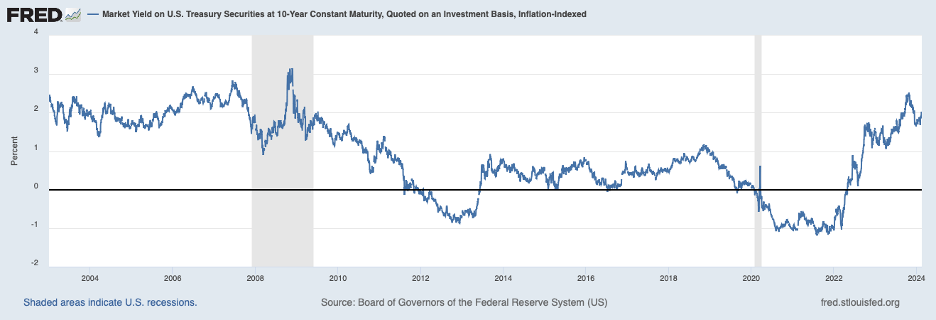
Pulling the evidence together suggests that interest rates have not been high enough. Shown next is the real interest based on the ten-year Treasury inflation-adjusted note which is indicative of interest rates that drive business and consumer spending. This measure of the real rate of interest has risen some over recent days in response to disappointing inflation data but is only marginally above the level in the fall of 2022 when the Fed was in the midst of its tightening cycle. Furthermore, this rate is not particularly high by the standards of the past couple of decades, as the chart shows, and these earlier times of higher real interest rates were not times when the Fed was fighting such stubborn inflation as now. Moreover, the recent somewhat subdued level of the real interest rate is helping to buoy stock and home prices, fueling some of the strength in aggregate demand and output growth.
The Fed’s Battle Against Inflation Is Still Not Over
In conclusion, the most recent batch of data on the economy and inflation indicates that the Fed’s battle against inflation is still not over. The disinflation process is more stubborn than implied by standard economic models, implying more monetary restraint is needed to reach price stability than the models suggest. Accordingly, the Fed will need to be restrictive for longer than currently believed by followers of these models and by market participants—more restrictive than is currently priced into financial and other assets. The sooner the thinking of observers gets aligned with a more realistic outlook for the necessary interest rate path for price stability, the sooner will come a repricing of assets that will help to bring us closer to price stability.
Featured Image: ben o’bro/Unsplash
