
February’s CPI data disappointed market participants, who were hoping to see more evidence that inflation was gliding down to the Fed’s 2 percent target amid continued output growth and a good labor market.
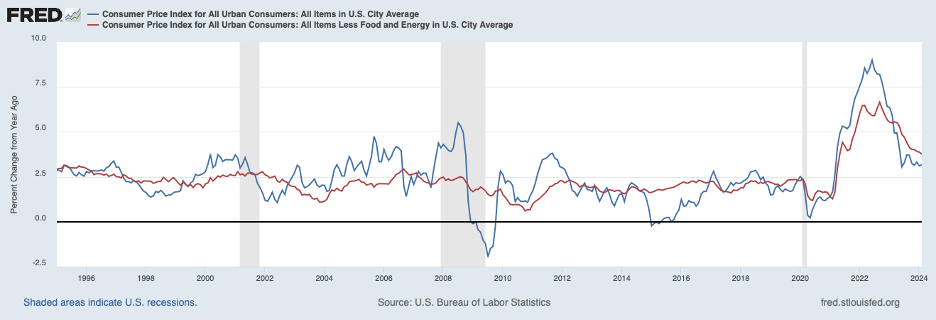
That is, market participants were looking for further evidence that a soft landing was in sight. Instead, the twelve-month increase in the headline CPI ticked up to 3.2 percent, shown by the blue line in the chart below. This increase is due in part to a jump in energy prices.
Comparatively, after removing energy and food prices, the twelve-month increase in the core CPI ticked down to 3.8 percent — the red line in the chart below. However, the monthly increases for December and January were both a disquieting 0.4 percent — nearly 5 percent at an annual rate.
Core Commodity Prices
There is further insight in decomposing core prices into core commodity prices and service prices, excluding rent. The following chart shows core commodity prices, shown by the blue line. Core commodity prices declined slightly over the twelve months ending in February by 0.3 percent. Declines in core commodity prices from mid-2023 primarily reflected an unwinding of supply-chain bottlenecks, which had been holding down CPI headline and core inflation. However, supply chain pressures appear to have normalized, and core commodity prices ticked higher in February.
It seems unlikely that headline and core inflation measures will continue to benefit from sustained declines in commodity prices.
Service Prices
The twelve-month increase in service prices excluding housing (rent of shelter) — the red line in the chart below — continued to move upward in February to 3.9 percent. This is well above the pace before the COVID-19 pandemic.
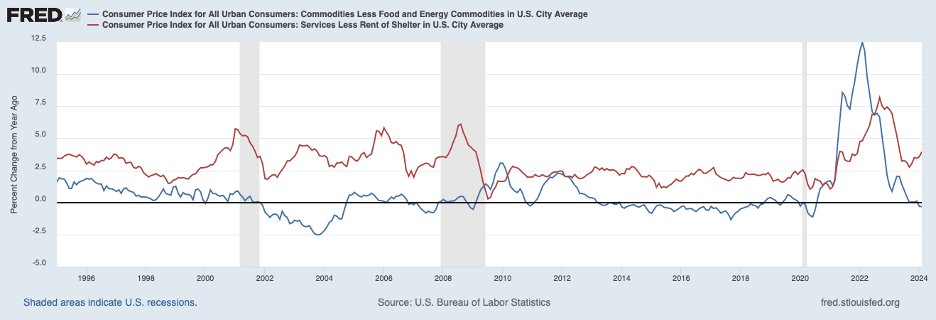
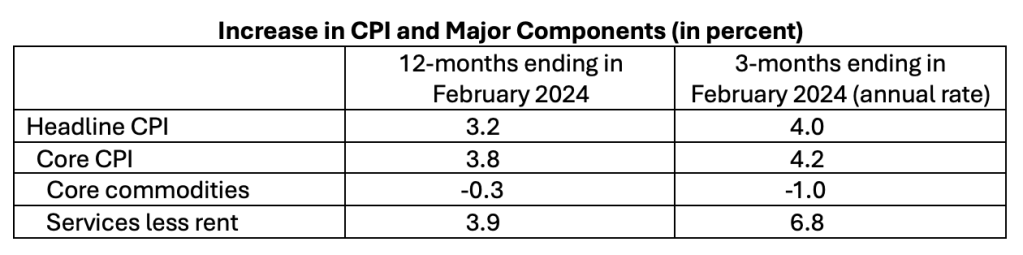
Moreover, as shown in the table below, prices of these services have accelerated to a 6.8 percent annualized rate over the past three months. Thus, unless there is an appreciable reversal of this trend, the Fed’s 2 percent target for consumer prices will be out of reach.
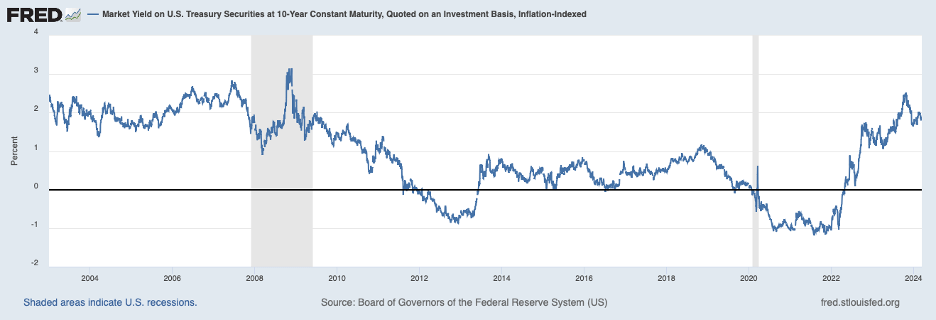
The above reading of the consumer price data suggests insufficient monetary restraint is in place to restore price stability. The following chart shows a measure of the real long-term interest rate — the yield on a ten-year Treasury inflation-protected security — which plays an important role in private spending decisions and, thus, output growth and conditions in the labor market. This interest rate is more than 2-1/2 percentage points above the level two years ago when the Fed began to tighten monetary policy. However, this rate is only a shade higher than a year ago and is not exceptionally high by the standards of the past quarter century.
Home and Equity Prices
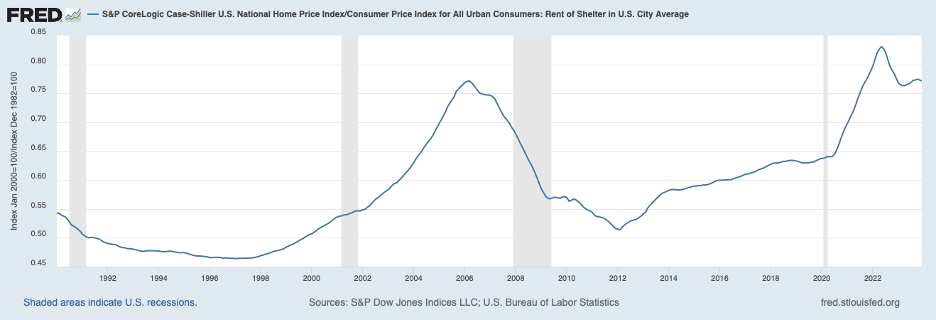
The current level of the real interest rate has not been high enough to restrain home and equity prices. The next chart presents home prices in relation to rents, an indicator of whether home prices are aligned with fundamentals or overstretched. Home prices remain very high in relation to rental rates and match the level in the spring of 2006 on the eve of the bursting of the housing bubble.
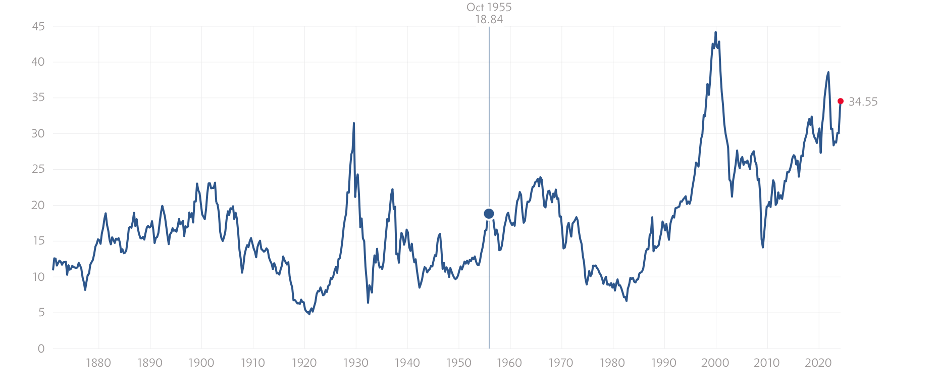
Similarly, equity prices are very high in relation to cyclically adjusted earnings, as shown in the Shiller PE Ratio chart below. At a level of nearly 35, equity prices in relation to earnings are at the upper end of a very long historical experience. As some have argued recently, it is possible that market participants foresee corporate earnings getting a substantial lift from artificial intelligence (AI) in the years ahead. This price-earnings ratio would return to a more normal range if such an earnings boost occurs. Nonetheless, high home and equity prices are acting to boost private spending and are contributing to the strong economy and labor market.
Shiller PE Ratio
The Labor Market
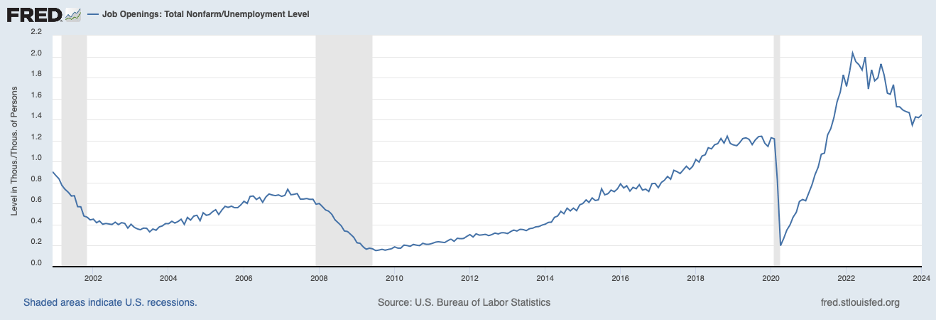
The labor market is tight, as shown in the next chart plotting the ratio of job openings to the number of unemployed. The ratio of 1.44 for January (most recent data) means that there were 1.44 jobs for each person unemployed. While this is down from its peak of 2.0 in March 2022, it remains extremely high and has not changed since last September. Thus, an excess demand imbalance continues in the labor market.
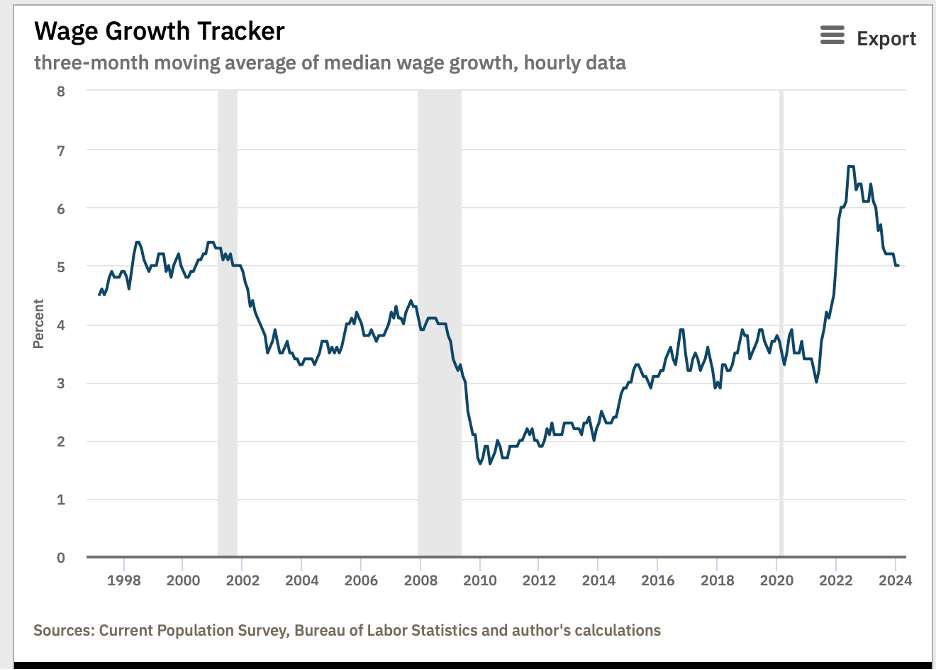
Tightness in the labor market is keeping wage growth high. The Atlanta Fed’s Wage Tracker (shown below) indicates that wage growth in February stayed at a 5 percent annual rate. While this rate is down from the peak of 6.7 percent in August 2022, it is still well above the roughly 3.75 percent rate that characterized the pre-COVID period. Elevated wage growth, undoubtedly, is placing upward pressure on consumer prices — especially in the service sector, where the wage bill is a large portion of total costs.
Inflation Dynamics
The dynamics of inflation are not fully understood. In the current situation, after a lengthy period of relatively stable prices, people and businesses have been surprised and confused by the jump in prices. Consequently, they seem to be rethinking their outlook for prices. Stories abound about consumers and companies coming to the realization that the burst in prices over the past three years will not be reversed and likely will be followed by further increases.
As a result, they are changing their behavior in the marketplace to protect themselves against further losses of purchasing power. Changing business and household behavior is likely contributing to the stickiness of current inflation dynamics. If so, Fed policy will need to remain restrictive longer than market participants have hoped.
Expectations
Market participants are betting that the Fed will begin lowering its target for the federal funds rate by 25 basis points in June (100 basis points equal 1 percentage point). By year-end, they expect the Fed to lower the target by a cumulative 75 basis points.
These expectations are holding down the level of real interest rates and the amount of monetary restraint currently in place. For more restraint to curb inflation, market participants will need to revise upward their expectations for the future path of the federal funds rate. The Fed can assist in providing more restraint by conveying that it does not concur with current market expectations. It foresees that it must hold the federal funds rate high for longer than envisioned by market participants to be assured that its policy stance will restore price stability.
The stakes in ensuring that inflation is on a clear downward trend toward the 2 percent target are so high that Fed policy should be inclined to err on the side of restraint. Instead, to err on the side of ease runs the very real risk that inflation gains to date would be lost and that sizable economic dislocations would be caused by a renewed effort by the Fed to restore price stability.
Featured Image: Jesse Bowser/Unsplash
