
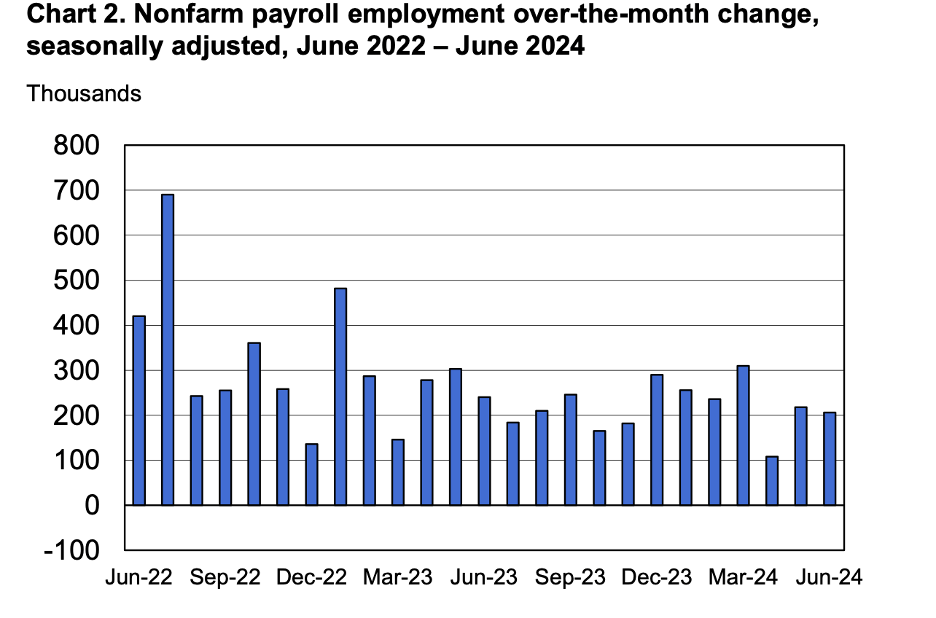
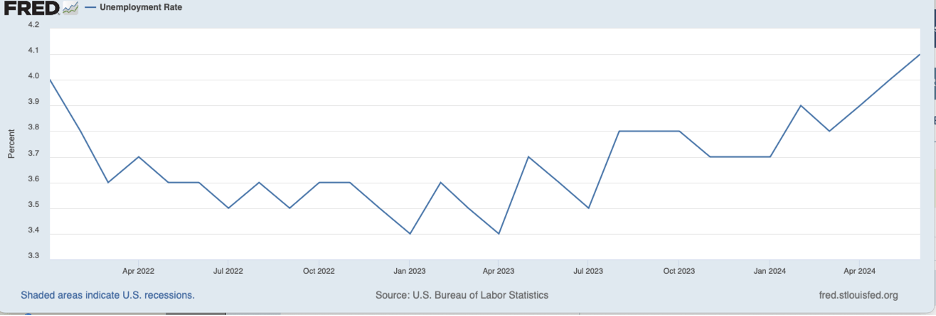
Financial market participants and observers greeted the jobs report for June with enthusiasm. The 206 thousand increase in employment, shown in the chart below, was coupled with a 54 thousand downward revision to employment gains in May. Many analysts saw this as a gradual slowing in hiring. Moreover, the unemployment rate climbed higher in June to 4.1 percent, as shown in the following chart.
This is 0.5 percentage points higher than a year earlier and broadly in line with current thinking about the maximum sustainable level of employment. Thus, the unemployment rate indicator suggests that the labor market is roughly in balance.
What about other labor market indicators?
Job Openings
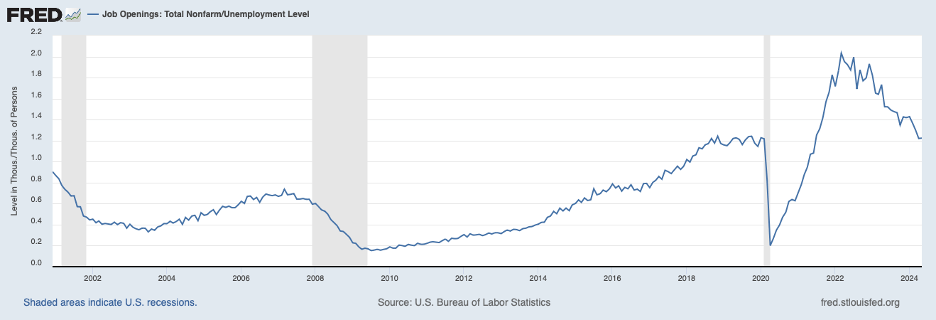
Turning to the next indicator, job openings in relation to the number of unemployed persons. The ratio of job openings to number of unemployed, shown in the following chart, has fallen from 2.0 two years ago to 1.25 more recently.
At the peak, there were two vacant positions for every unemployed person; now, there are 1-1/4, roughly the same ratio as before the COVID pandemic.
Some have viewed the return to the pre-pandemic ratio to mean that this indicator also suggests that balance has been restored to the labor market. However, this ratio was high by historical standards in late 2019, and many labor market analysts characterized the labor market at the time as being “hot.”
Job Quits
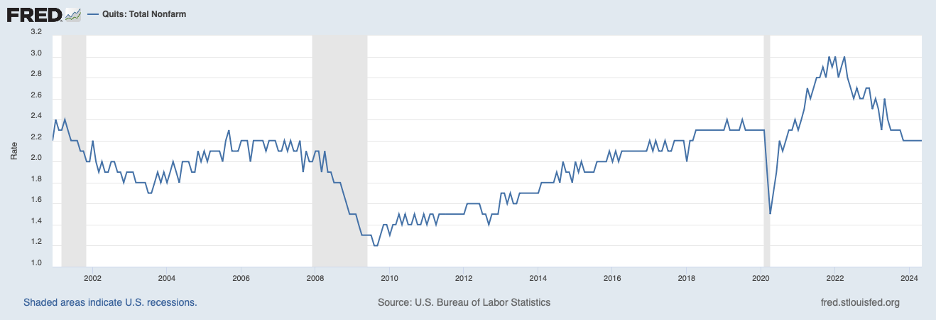
Still another labor market indicator is the rate of job quits, shown next. When the job market is strong, workers are more inclined to quit their current job, believing they will have little difficulty finding a new one. The quits rate in the chart below peaked around the same time as the ratio of job openings to the number of unemployed and has returned to the pre-COVID rate, which, like the job openings ratio, was high by historical standards.
Wages
Turning to wages, the following chart shows that the twelve-month rate of increase in average hourly earnings of private service workers began moderating in 2022 but has leveled off more recently at around 3.6 percent.
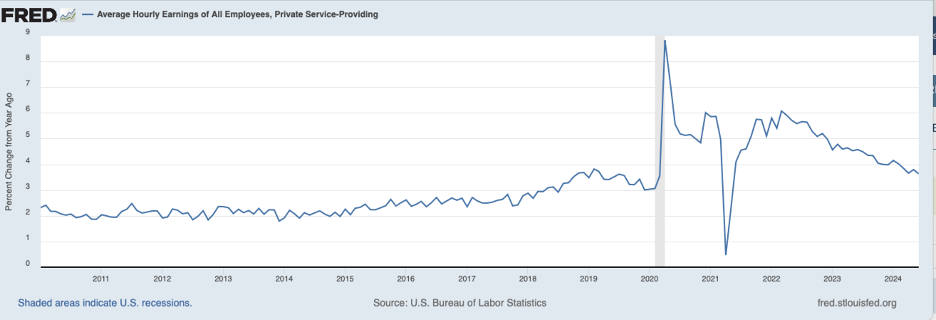
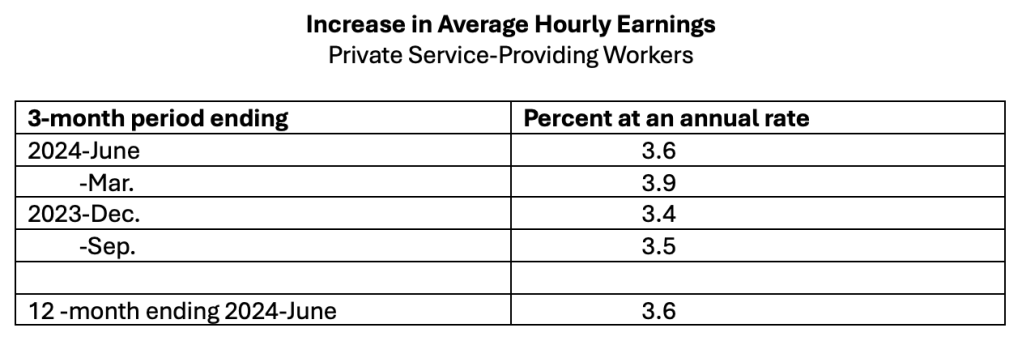
The annualized increase for the three-month period ending in June was the same 3.6 percent rate for the twelve-month period ending in June, as shown in the table. (Indeed, the rate of increase in the first six months of 2024 exceeded by a bit the rate of increase over the second half of 2023.)
The growth in service-sector wages is about 1-1/4 percentage points above the pre-pandemic period. (The service sector is shown because the average hourly earnings of service workers are not affected as much by swings in the hiring of high-wage relative to low-wage workers as the average hourly earnings for all private-sector workers. Also, the service sector has come to be seen as a bellwether for underlying inflation pressures in the economy more broadly owing to supply-chain swings buffeting the market for commodities.)
Wage growth, especially in the service sector, is being held down by the surge of immigrants augmenting the labor force. Calibrating immigration’s impact on wage growth is complicated by uncertainties around the actual number of immigrants entering the country and the pace at which immigrants are entering the labor force and competing with established workers. However, if the flow of immigration slows, this source of downward pressure on wages and labor costs will start to fade.
Thus, it does not appear that wage growth is settling into a pace aligned with the low inflation period before COVID, even with outsized immigration. If wage growth is stuck above a rate associated with the Fed’s 2 percent target, what will it take to return to the Fed’s inflation target?
Inflation Persistence
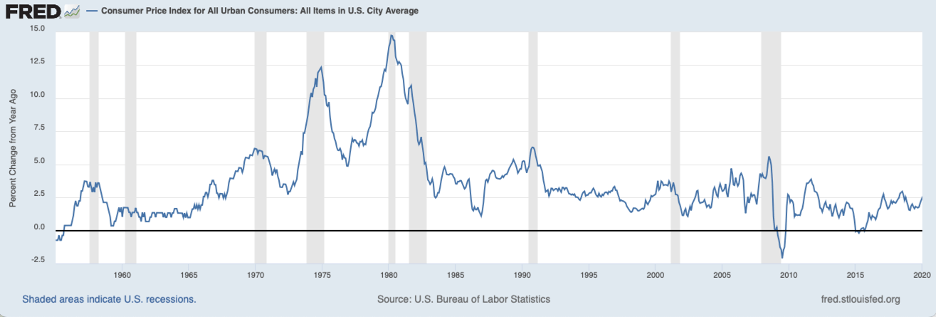
Historically, sustained reductions in inflation have been accompanied by or preceded by recessions, except for the 1960 recession. This pattern is shown in the chart below for CPI inflation. Recessions are shown by the shaded bars. Standard economic models relate inflation to slack in labor and product markets (as slack increases, inflation decreases) and to expectations of future inflation (as expectations of inflation increase, actual inflation increases).
Typically, inflation expectations are stubborn to come down until actual inflation has come down, which means economic slack must develop to bring inflation down. The following chart shows household inflation expectations over the next five years from the University of Michigan Survey Research Center. The chart shows that inflation expectations are up a little from the pre-COVID period and have not fallen along with the drop in actual inflation that began in mid-2022, broadly in line with previous episodes of persistent inflation.

No doubt, frequent statements of commitment to 2 percent inflation by Fed officials, along with the monetary tightening actions by the Fed that started in March 2022, have been helping to hold down inflation expectations and reducing the amount of slack needed to restore price stability.
Further evidence of ongoing inflation persistence can be seen in the most recent survey of small businesses by the National Federation of Independent Business (NFIB) for June 2024. The chart below shows that the percentage of respondents who have raised prices over the past three months and plan to raise prices over the next three months remains high by pre-COVID standards.

Worth noting is that historical experience indicates that once inflation has displayed a degree of persistence, as the evidence above demonstrates for the current period, inflation dynamics develop in such a way that monetary policy needs to be more restrictive than otherwise if actual inflation is to be lowered on a sustained basis.
Putting the Pieces Together
The labor market has cooled some but will need to cool further to be back in balance. Moreover, wage growth in the service sector, which is being held down by immigration, has leveled off recently, placing more upward pressure on business costs and inflation than in the pre-pandemic period. In these circumstances, slack in labor and product markets will be needed if the Fed is going to be successful in achieving 2 percent inflation. Calibrating slack by the unemployment rate, the unemployment rate will need to rise somewhat further to break the back of the current inflation.
This is not the conclusion that many observers and financial market participants have reached. Financial futures markets have currently priced in a 25-basis point cut in the federal funds rate in September and a second one before year-end. For this path of the federal funds rate to be consistent with progress toward the Fed’s 2 percent target, the economy would need to weaken more than current indicators show. If the Fed’s 2 percent target is achieved without slack in the economy, the current episode will go into the record books as a clear outlier to previous periods of sustained disinflation.
Featured Image: Scott Webb/Pexels

Thanks for info not sure I understand it all just know I seem to have lest to spend
Get Outlook for iOShttps://aka.ms/o0ukef
LikeLiked by 1 person