
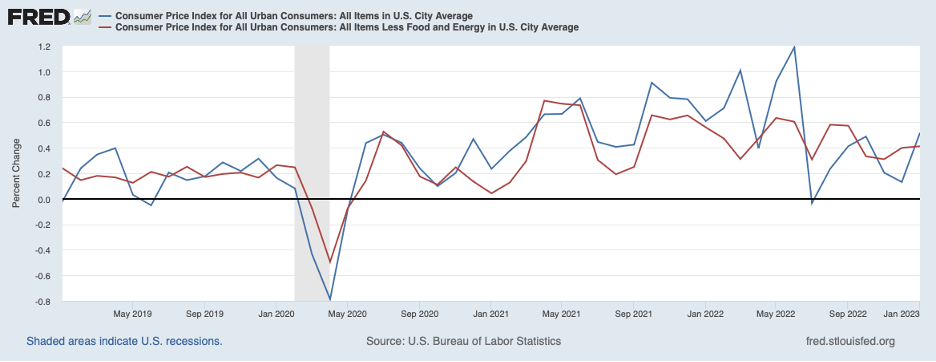
The most recent consumer price data (for January) were a disappointment. As shown in the chart below, headline inflation (the blue line) picked up largely owing to a swing in energy prices. However, even when volatile energy and food prices are removed, core inflation (the red line) ticked higher, raising doubts about whether underlying inflation is continuing to slow.
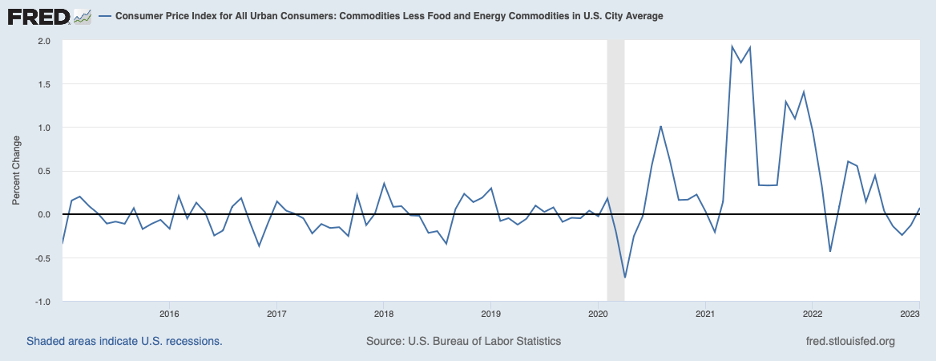
Dissecting the data further, commodity prices, the next chart, had declined in some previous months from an easing of supply-chain restraints but turned up in January. As the impact of the unwinding of supply chain restraints fades further, commodity price inflation can be expected to pick up some more.
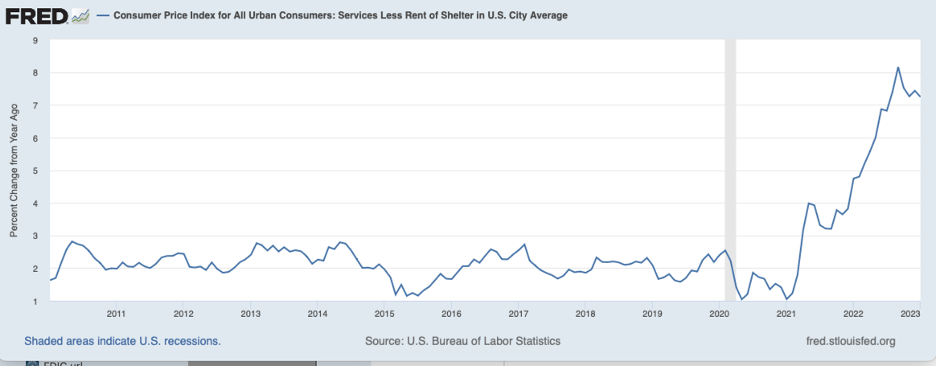
Moreover, many analysts, including some policymakers at the Fed, regard service prices apart from housing costs to be a good indicator of underlying inflation at present when special factors are distorting prices of commodities and housing costs. The next chart shows prices of services excluding the rent of shelter through January. This measure of consumer price inflation remained very high into early 2023 and most likely is getting a boost from wage pressures coming from a very tight labor market for service workers.
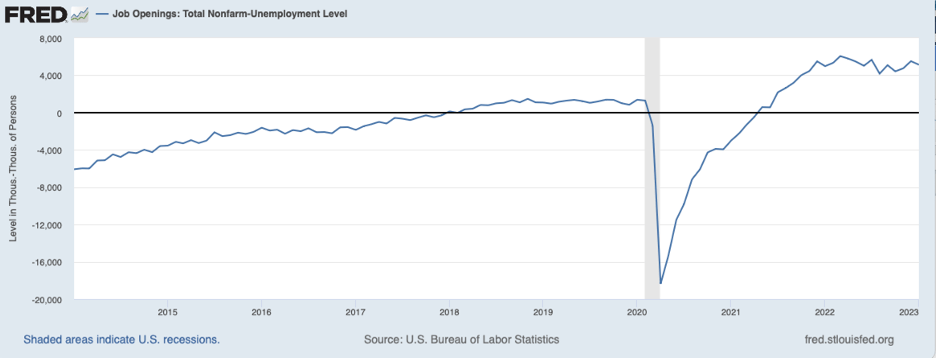
Based on the above, it is reasonable to conclude that underlying inflation has not moderated much from its peak several months ago. Contributing to current inflation is the continuation of tight product and labor markets. The chart below shows the excess of job openings over the number of unemployed persons through January (most recent data). The chart indicates that the substantial excess demand for labor continued into early 2023.
More recent news on the labor market comes from the February jobs report and initial claims for unemployment insurance, the next chart. The February jobs report showed that employment growth was brisk again last month and initial claims through early March continued to run at historically very low levels.
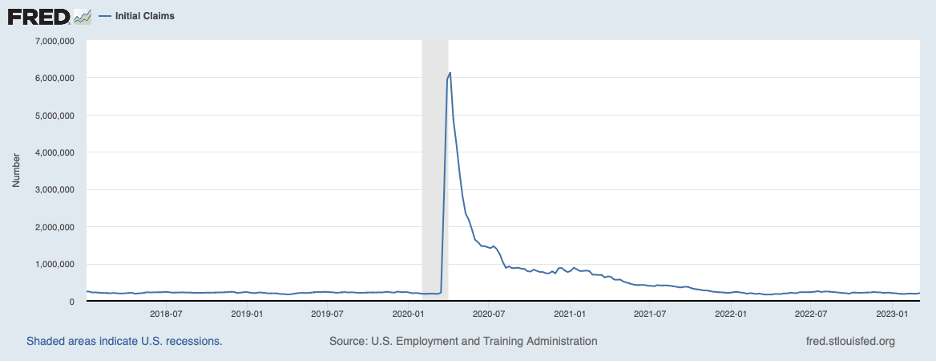
Neither report has yet to give a hint that the hot labor market has begun to cool. This ongoing excess demand for labor is placing upward pressure on increases in both wages and prices.
Also contributing to inflation momentum are inflation expectations. As noted in a recent commentary (see February 13, 2023 post, Fed Policy: The Importance of Vigilance), longer-term inflation expectations have moved only a little higher in the last couple of years—likely reflecting the Fed’s repeated insistence that it won’t end policy restraint until it is sure that inflation is on a path back to 2 percent. Two survey measures of longer-term inflation expectations are shown in the chart below.
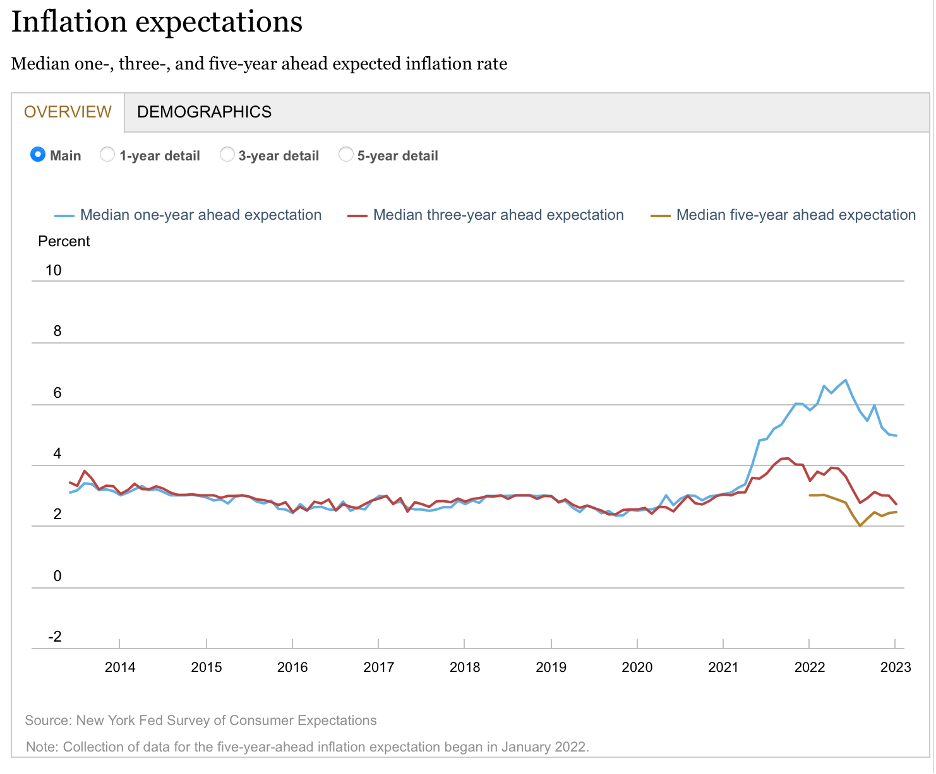
Expectations of inflation three years ahead (red line) have returned to the area that prevailed before the pandemic. Expectations of inflation five years ahead (gold line) have been running marginally above 2 percent in recent months, not much above the Fed’s 2 percent inflation target. However, shorter-term inflation expectations (the blue line) remain quite high, likely imparting a boost to recent inflation.
As noted in this space for more than a year, once inflation rises to a rate that captures the attention of and affects the decisions of businesses and households it takes on a momentum of its own, beyond that implied merely by continued tight labor markets and elevated shorter-term inflation expectations. The forces behind this momentum are poorly understood, as evidenced by the incomplete understanding of all the forces that contributed to the Great Inflation of the late 1970s and early 1980s. The Fed’s monetary policy will need to subdue these forces before inflation can get on a path that returns it to a 2 percent rate on a sustained basis. This means that monetary policy will need to be more restrictive and for longer than the current situation would otherwise suggest. The result likely will be a recession.
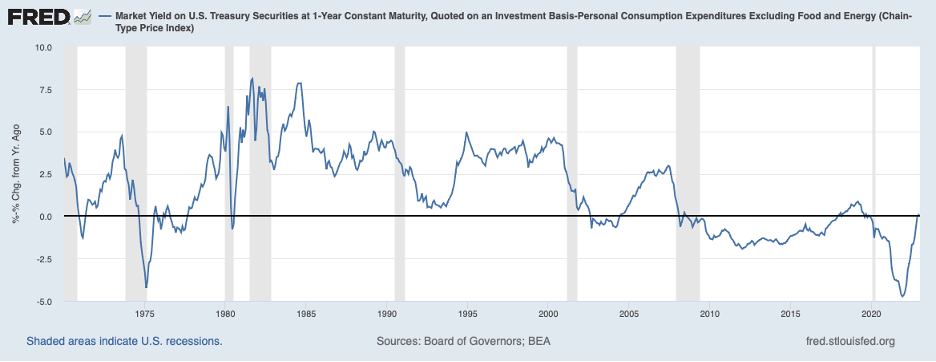
It is worth noting that monetary policy has not become restrictive yet—that is the real federal funds rate remains below the neutral rate. The next chart shows a measure of the real federal funds rate—the nominal federal funds rate less the twelve-month percent change in the core PCE consumer price index. This measure was a shade above zero in January (most recent data available for the core PCE index), still notably below the neutral rate for the real federal funds rate of around ½ to ¾ percent. Said differently, the Fed will need to raise its target for the federal funds rate by roughly another ½ percent to reach neutral (the measure shown does not reflect the ¼ percent increase announced on February 1).
A Taylor Rule prescription is helpful to get a better sense of how high the federal funds rate will need to go for the Fed to achieve its 2 percent target for inflation. The Taylor Rule was developed by Professor John Taylor of Stanford to characterize Fed policy actions during a period when macroeconomic performance was very good—low inflation and low and relatively stable unemployment. The Taylor Rule parametrizes the Fed’s response to any gap between actual inflation and the 2 percent target for inflation and any gap between the actual unemployment rate and the unemployment rate that is associated with achieving maximum employment. The model developed by Taylor can be used to derive an appropriate setting of the nominal federal funds rate in the current period.
The next chart shows the actual federal funds rate (black line) and the rate prescribed by three different variants of the Taylor Rule (the gold, green, and blue lines). The last points plotted are for the fourth quarter (the most recent quarterly data available). At that time, the actual federal funds rate was well below the rate prescribed by any of these variants. These variants prescribed a federal funds rate of 6 to 7-1/2 percent for the fourth quarter of last year and likely prescribe similar levels for now. That is, the Taylor Rule is saying that the federal funds rate will need to be raised 1-1/2 to 3 percent above the current level of the federal funds (from its current 4-1/2 percent or so level now).
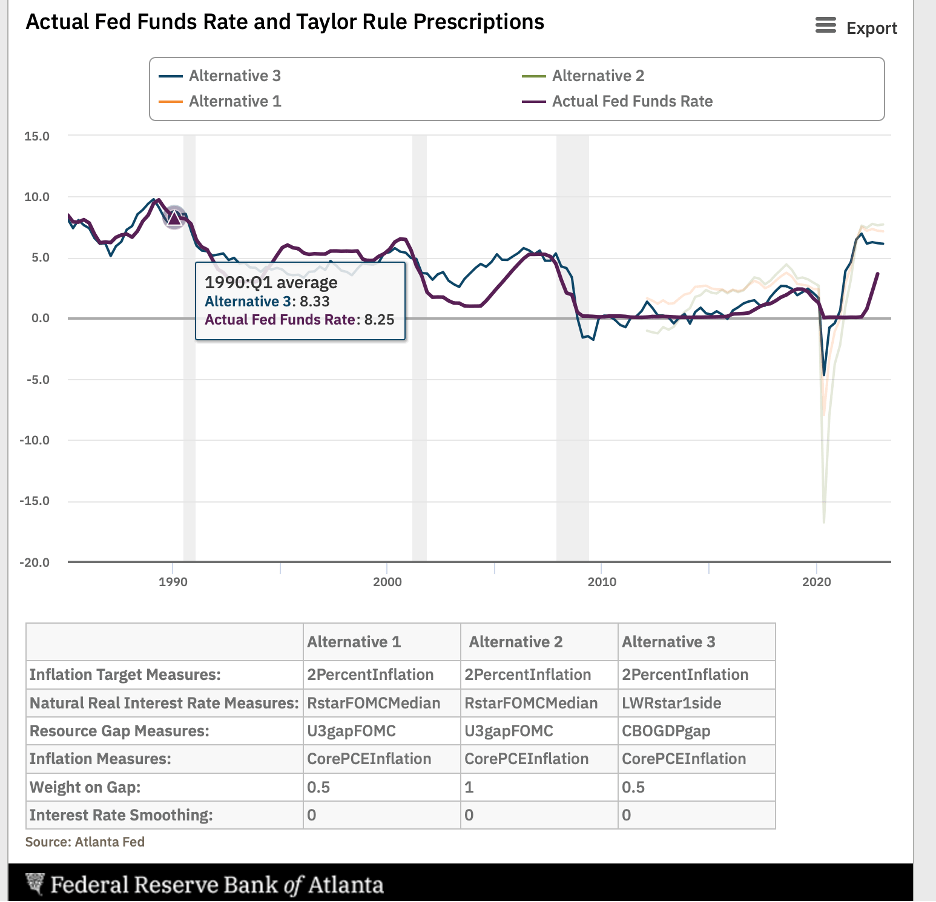
It is worth noting that the Taylor rule was based on a period when the problem of inflation momentum was absent. Based on the discussion above, the federal funds rate will need to be higher than what the Taylor Rule suggests to break the back of inflation momentum. Clearly, this reasoning points to a federal funds rate above 6 percent—perhaps well above 6 percent.
Participants in financial markets have recently raised their projections for the federal funds rate in response to recent data and statements by Fed officials—notably congressional testimony by Chair Powell. Market participants have currently priced in a ½ percent increase in the Fed’s target for the federal funds rate on March 22 and another ½ percent increase by midyear. Market participants see the federal funds rate staying around 5-1/2 percent or so until the fall when they envision the Fed starting to ease policy.
Although market pricing has gotten closer to where it needs to be for inflation to be on a clear downward trajectory, it still has some distance to go. This reasoning implies that longer-term interest rates will need to increase further and the slump in equity prices has further to go. The chart below shows the S&P 500 stock price index (red line) and a price-earnings (P-E) ratio that has been adjusted for the economic cycle. Stock prices have fallen about 15 percent from their peak a little more than a year ago and so has the cyclically adjusted P-E ratio.
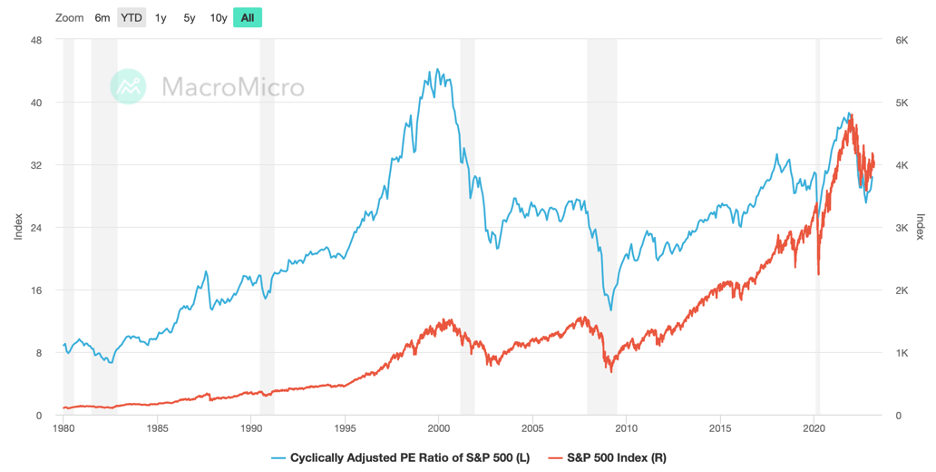
However, the cyclically adjusted P-E ratio is still at the high end of its range of the past couple of decades, suggesting some scope for further declines in stock prices. Moreover, the cyclically adjusted P-E is based on the current market expectations for the path of the federal funds rate and does not reflect the very high likelihood that the Fed’s resolve to bring inflation back to 2 percent will require a steeper trajectory for the federal funds rate. Hold onto your hat! The wild ride is still not over.
