It would be easy to conclude that with the surprisingly small increase in employment for October and the Fed’s subsequent 25 basis point cut in its target for the federal funds rate that the job market may be on the cusp of weakness, inflation has come under control, and the Fed is on a steady path of rate cuts until it reaches the neutral rate (the interest rate which is neither restrictive nor stimulative). Is that a reasonable inference?
Labor Market Strength and Wage Growth
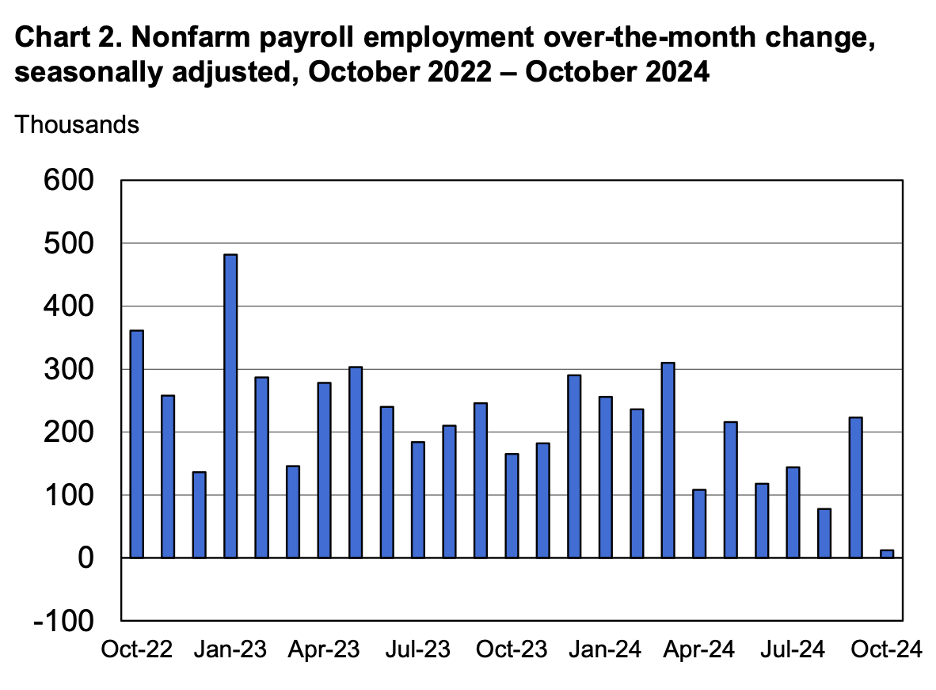
The chart below shows that job growth was only twelve thousand in October, the weakest employment change in nearly four years. The October data were held down by the Boeing strike and the effects of two devastating hurricanes that hit the Southeastern part of the country.
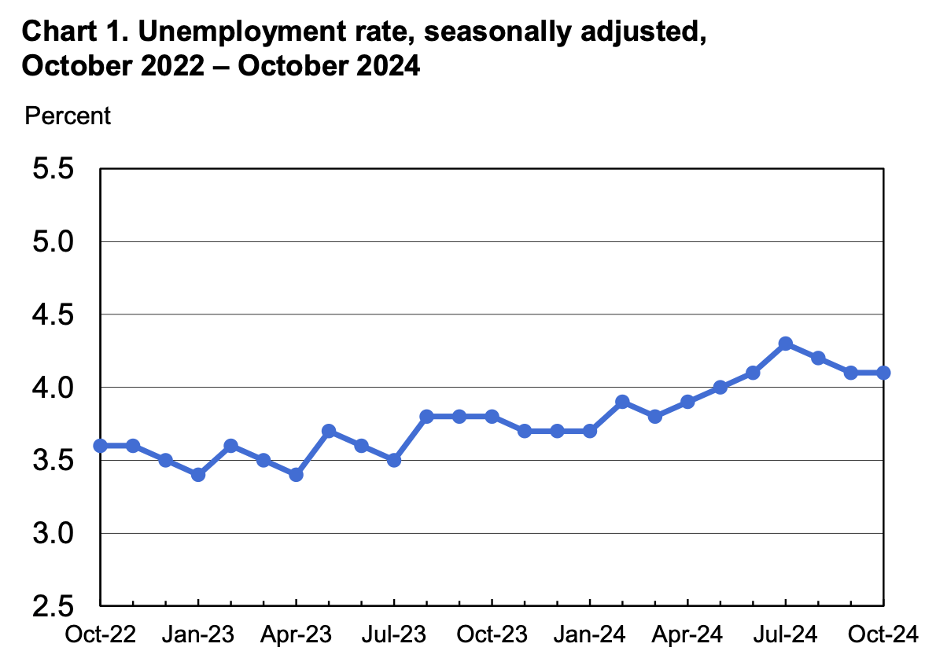
In contrast to the employment data for October, the unemployment rate held steady at 4.1 percent, shown next, up 0.3 percent from a year earlier when the labor market was exceptionally strong. The October unemployment rate, 4.1 percent, is close to the level that experts estimate to be the sustainable rate of unemployment consistent with stable inflation (the natural rate of unemployment or the NAIRU — nonaccelerating inflation rate of unemployment).
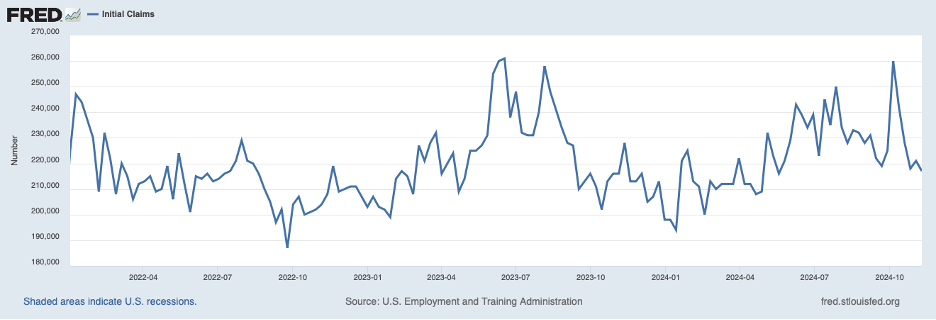
Looking at other labor market indicators, it is hard to find evidence of impending weakness. The following chart shows initial claims for unemployment insurance through November 9. After a storm-related spike in early October, claims have returned to the low levels of the spring.
Less timely, the ratio of job vacancies to unemployed workers (the next chart) appears to have stabilized around unity through September (most recent data). This ratio is near the level recorded on the eve of the pandemic when the consensus was that the job market was hot.

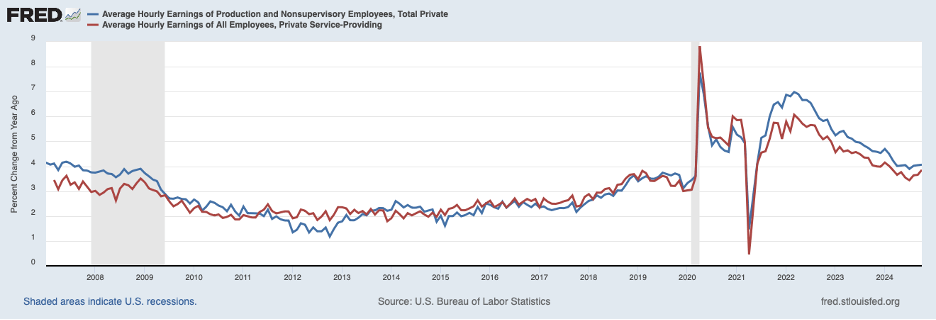
Further evidence of firmness in the market for labor can be seen in wage growth through October. Below are twelve-month changes in average hourly earnings for all production and nonsupervisory workers (the blue line) and service-providing workers (the red line). Both measures have stopped declining — they even ticked up recently — and are running noticeably above the pace during the very tight labor market in the runup to the COVID shock.
Wage gains have been outpacing price increases, and real compensation (overall worker compensation divided by the PCE index of consumer prices) continued on an upward trajectory through the end of the third quarter, shown in the following chart, recovering the losses over 2021 and 2022.

Other evidence on the economy, including retail sales for October, suggests that real GDP growth remains strong into the fourth quarter. The fourth-quarter growth of real GDP estimated by the FRB Atlanta is 2.5 percent, comparable to the average pace over the first three quarters of the year, which was quite firm.
Inflation Trends
Turning to prices, the headline CPI again rose 0.2 percent in October, and the core CPI (excluding volatile food and energy prices) again rose 0.3 percent. Consequently, the twelve-month increase in headline inflation edged up to 2.6 percent, shown by the blue line in the chart below, and the twelve-month increase in the core measure, the red line, stayed at 3.3 percent. The core measure is widely thought to be a better indicator of the underlying inflation rate, and this measure remains well above a pace consistent with the Fed’s 2 percent target. (The Fed sets its target in terms of the PCE index which is believed to have less of an upward bias than the CPI and averages about 0.6 percentage points smaller increases than the CPI.)

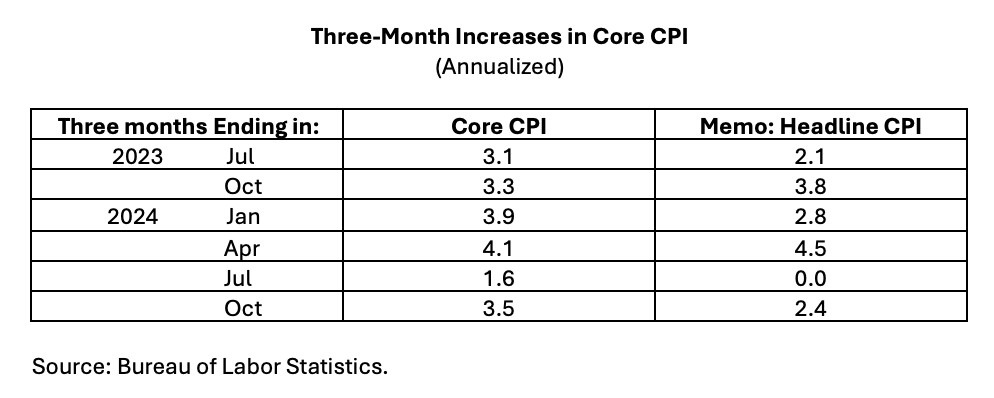
The above discussion concerns the twelve-month changes in the headline and core CPI. Frequently, twelve-month changes are slow to reflect changes in trends occurring within that period. To see if core inflation may have slowed recently, the table below shows three-month increases in core inflation ending in the months shown (note that they are annualized for comparability). The three-month change in the core CPI appeared to be slowing for the period ending in July 2024 but snapped back in the period ending in October. Moreover, the 3.5 percent increase for the period ending in October 2024 is actually above the 3.3 percent rate over the comparable period in 2023.
Breaking down the core CPI into key components can shed some light on underlying inflation. Shown in the chart below are twelve-month changes in core commodities prices (blue line), rent of shelter (green line), and services excluding rent of shelter (red line). Supply chain disruptions greatly impacted commodity prices during the COVID shock — soaring in 2021 and 2022 — and then unwinding. The twelve-month change for the period ending in October 2024 remained negative, reflecting the supply chain unwinding, but core commodity prices have been flat over the last three months. Looking ahead, it will be important to see whether core commodities prices decline slowly, as they did during the pre-pandemic period, or whether they remain flat or even start to rise mildly, pointing to broader inflation momentum.
Increases in rent of shelter have slowed to 4.9 percent from the peak of 8.3 percent in March 2023. However, the slowing of rent inflation has stalled in recent months. Other evidence on rental rates on new leases suggests that further slowing in rent of shelter should lie ahead, and the three-month annualized rate of increase for the period ending in October, at 4.4 percent, may be an early indicator that further deceleration is underway.
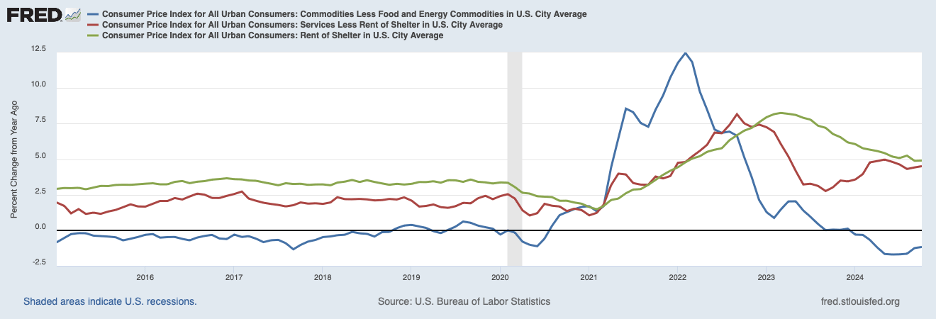
Of more concern has been the recent behavior of other service prices — service prices excluding rent of shelter. The sustained slowing of these service prices over much of 2023 proved to be a head-fake, and service prices retraced a portion of that deceleration through the spring of this year and have since been increasing at around a 4.5 percent rate, well above the pre-COVID pace. Moreover, these service prices increased over the three months ending in October at the same pace as over the twelve months ending in October, implying that declines in the twelve-month change are not in the pipeline. Furthermore, wage growth in the service sector, shown above, is not pointing to relief in service prices coming from the cost side.
In summary, the key to the outlook for inflation and the Fed achieving its 2 percent target for inflation will be service prices, excluding rent and core commodities prices. Service price inflation remains high and has been stubborn to slow recently, and commodity prices may not return to the mild declines that characterized the pre-pandemic period.
Navigating Persistent Inflation and Economic Growth
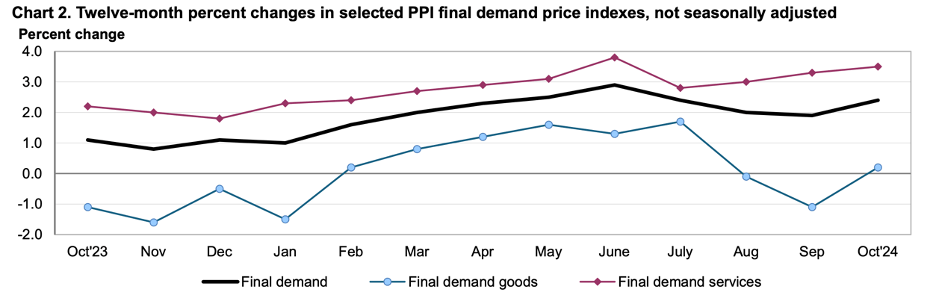
Other recent evidence on prices is consistent with the inflation dragon not being slain yet and inflationary momentum continuing. Shown below are twelve-month changes in goods prices (blue line) and service prices (red line) that appear in the PPI (producer price index). Service price inflation has been on a mild upward trend since the beginning of this year, while goods price inflation returned to positive territory in October.
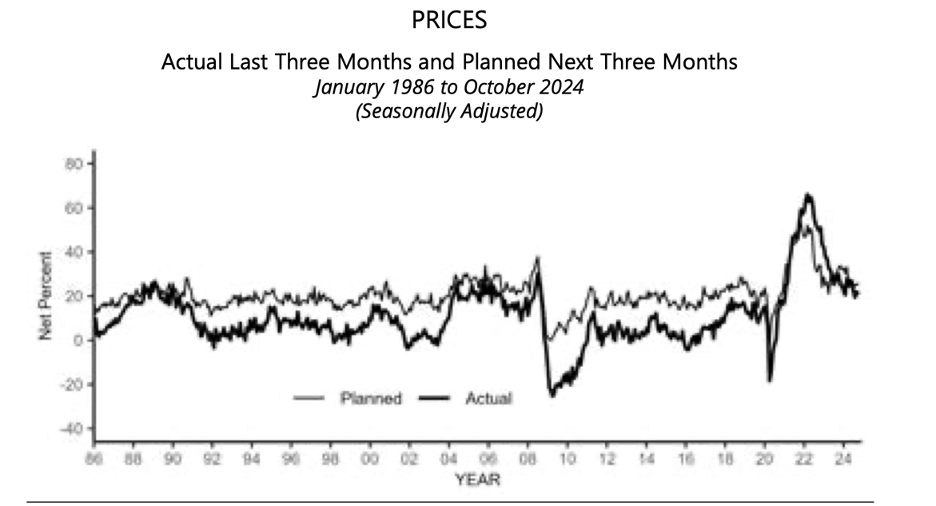
The next chart shows the most recent small business price survey conducted by the National Federation of Independent Businesses (NFIB) for October. The thicker line shows the net percentage of respondents who raised their prices over the previous three months, and the lighter line shows the net percentage who plan to raise prices in the coming three months. Both are down from their peaks but remain high by the standards of recent decades.
The persistence of underlying inflation and continued solid economic growth suggest that monetary policy may not be as restrictive as many believe. A common measure of the degree of monetary restraint is the excess of the current real federal funds rate over the neutral rate. The current real federal funds rate, after the early November 25 basis point cut, is around 1.9 percent, and estimates of the neutral rate by Fed policymakers tend to center around 0.8 percent, implying an excess of around 1.1 percentage points. The excess is down from around 1.9 percentage points before the Fed started to cut rates in mid-September. The Fed seems to judge the current 1.1 percentage point excess to be still quite restrictive and envisions several further rate cuts until this excess is removed. The timing of those cuts, though, has become more uncertain in the wake of the most recent inflation news.
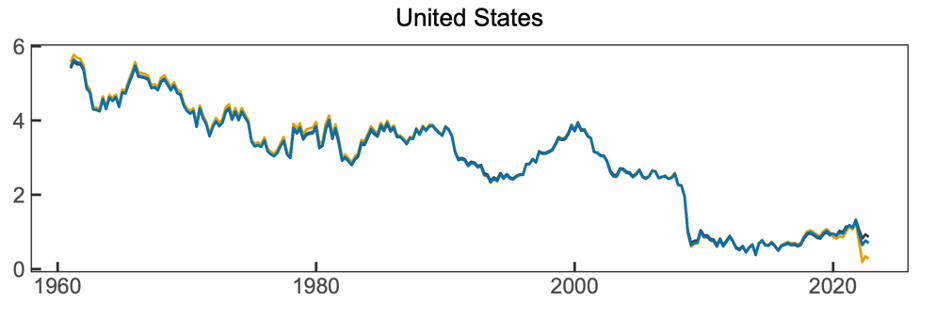
The Fed’s judgment depends importantly on its assessment of the neutral real federal funds being in the vicinity of 0.8 percent. The neutral rate is not directly observable and must be estimated using a model. A model estimate that gets a lot of attention among analysts is prepared at the FRB NY and is shown in the chart below. Note that this estimate of the neutral rate was on a general downward trend and then dropped abruptly at the time of the financial crisis in 2008. Some years later, the estimate of the neutral rate turned up and was on a mild upward trend until the onset of the pandemic, when it dropped again. Economic principles suggest that the real neutral rate is affected by the saving habits of the public and the rate of return on investments, both of which should be changing slowly and not as abruptly, as shown in the chart. Consequently, the massive shocks of the financial crisis and COVID may have disrupted things so much that estimates of the neutral rate have been distorted. If so, the true real neutral rate may be a good bit higher than 0.8 percent, and monetary policy may not be very restrictive at all. For example, if the neutral rate were 1.5 percent, Fed policy would not be very restrictive at all.
The above discussion calls for considerable caution in considering further rate cuts, especially if the Fed is concerned about reversing course and returning to a tightening posture. Moreover, early glimmerings are that fiscal policy is likely to turn decidedly more expansive in the next few years, which will add economic stimulus at a time when the economy already is strong, and more pressure will be unfolding in credit markets as the Treasury competes more aggressively for funds. Indeed, the increase in Treasury yields over recent weeks likely reflects a growing awareness that greater tensions in credit markets are forthcoming; larger credit demands stemming from a strong economy, fostered by an upturn in investment, are envisioned to be supplemented by heavier Treasury borrowing. Such a setting is not conducive to further progress on the inflation front.
Header Image: Marra/Unsplash

Tom, your reading of the tea leaves jives with the message I have been giving Offit clients for the past year or so, which gives me comfort. This story has a long way to play out. Thanks for keeping us posted on your thoughts. Todd
Get Outlook for iOShttps://aka.ms/o0ukef
LikeLike
I’m pleased that there are some other analysts who see inflation as a more serious problem than the Fed. I was a part of the team that struggled to get inflation down starting in October 1979. It took three agonizing years.
LikeLike