
The supply shock from the war in the Middle East is the second negative supply shock in a year, coming on the heels of sharp boosts in tariffs in April 2025. Negative supply shocks have the effects of pushing up prices while holding down output and employment. Moreover, both shocks have come at a time when inflation has been running above the Fed’s 2 percent target. Readings on employment have generally been more favorable but some see the labor market as fragile and could deteriorate quickly, especially in light of high-profile announcements of layoffs. This situation poses a serious policy dilemma for the Fed.
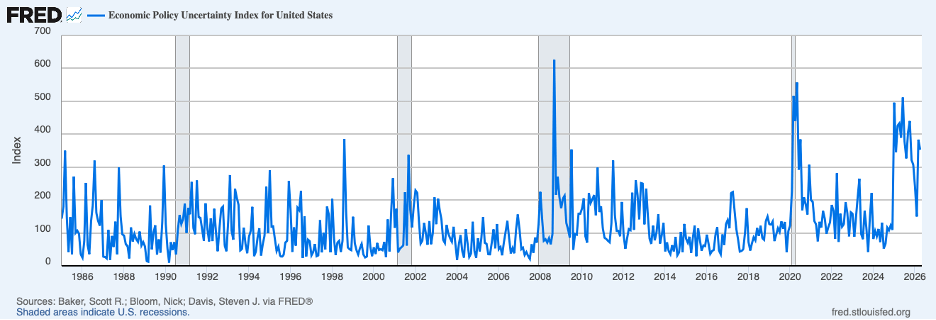
Recent developments have fueled uncertainty about economic policy, as seen in the chart below. Policy uncertainty remains extraordinarily high, which discourages spending decisions by businesses and households and acts as a headwind facing the economy.
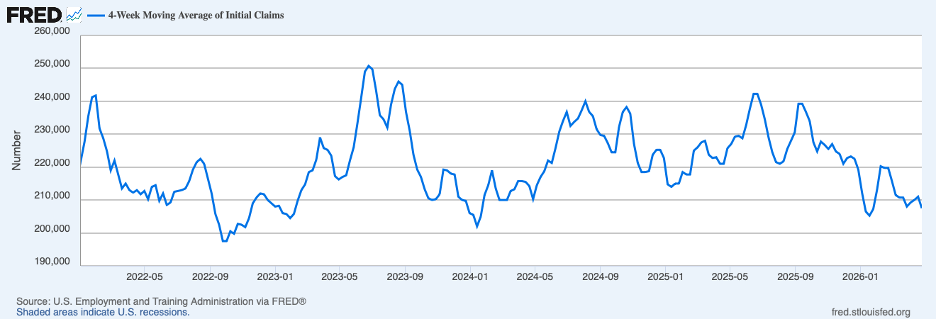
Nonetheless, recent data suggest that the labor market is holding up pretty well despite uncertainty not only about economic policy but also about a new wave of automation that will displace workers. The next chart shows that new claims for unemployment insurance are low, suggesting that worrisome headlines about layoffs are not being translated into applications for unemployment insurance.
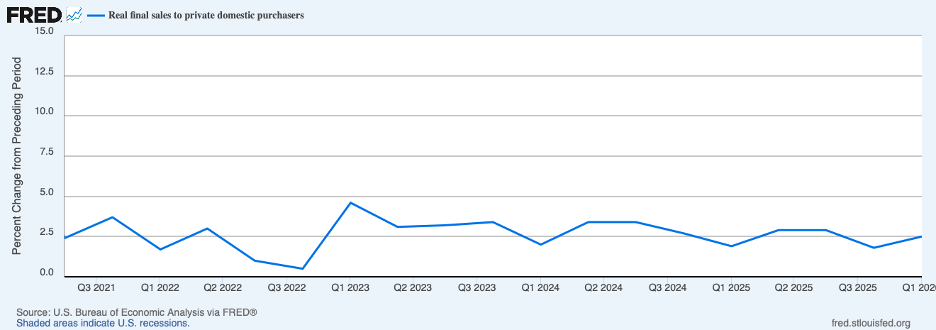
Data just released on output and spending for the first quarter of this year point to solid growth in spending, shown below. The chart shows that sales to final purchasers adjusted for price changes have continued to grow around a 2-1/2 percent annual rate even as job growth and the income that comes from it has slowed dramatically. (Recent data on real GDP have been buffeted by the government shutdown in the latter part of 2025 and by volatility in net exports.) The recent growth in spending has been near or above the rate of growth of potential output even with the depressing effects of the negative shocks.
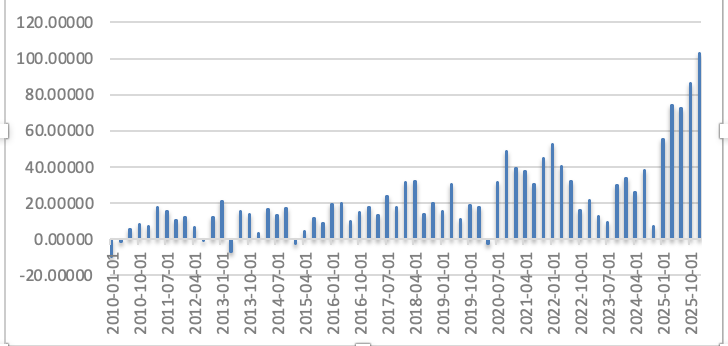
That recent growth in demand has been powered by business investment — notably in computers and peripherals, software, and research and development — as businesses across the spectrum are scurrying to avail themselves of the potentially high returns and a competitive edge from investments in AI. This boom can be seen in the chart below where the increase in investment in these components topped $100 billion in the first quarter (not adjusted for price changes). Not included are larger investment outlays for electric power generation to meet the surge in demand by data centers.
Change in Private Fixed Investment in Computers, Software, and R&D
(Billions of dollars)
Meanwhile, consumer spending continues to be well-maintained, aided by wealth gains from lofty stock prices.
The news on inflation, in contrast, has not been as good. The chart below shows that headline PCE inflation (twelve-month percent change, the broken green line) rose to 3.5 percent in March and core PCE inflation rose to 3.2 percent (the solid blue line). Headline inflation was a percentage point higher than a year earlier and core inflation a half-percentage point higher. Contributing to the pickup in both measures of inflation have been the tariffs. In addition, the recent run-up in headline inflation owes to the Middle East oil shock.
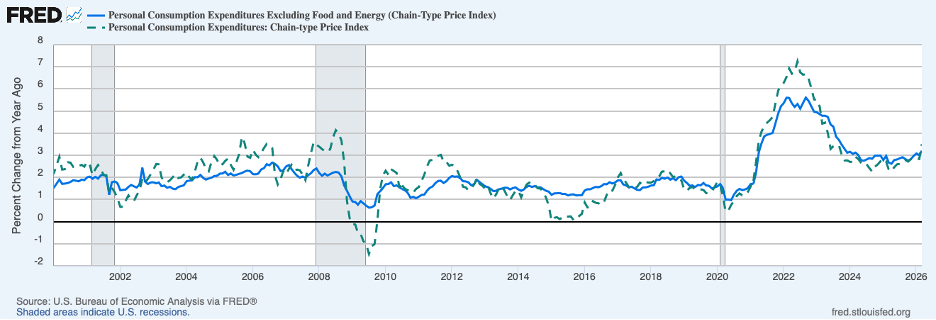
Tariffs and oil prices have their primary effect on goods prices. The blue line in the next chart shows a spike in goods prices in March.
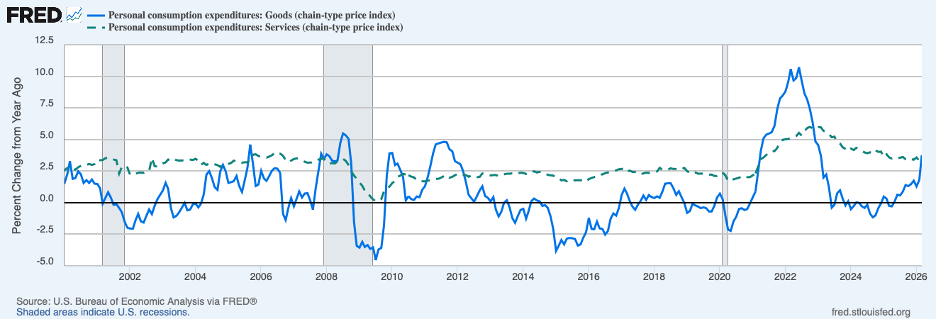
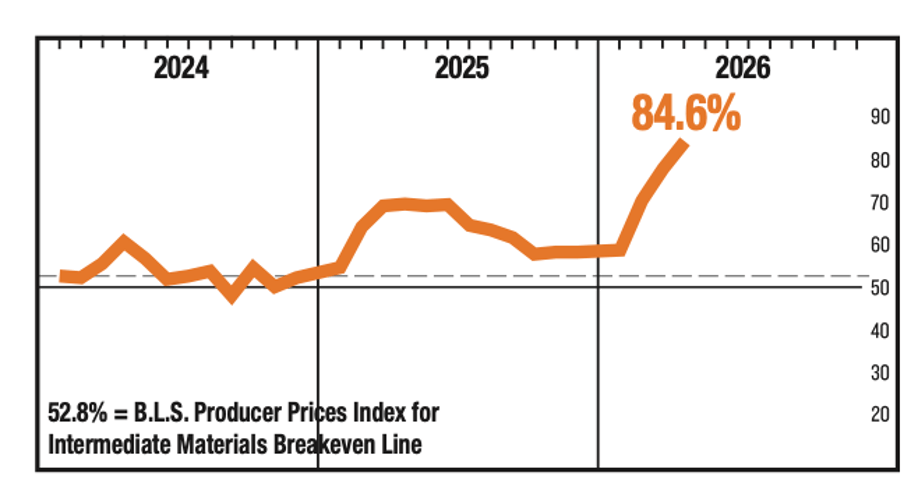
Supply managers report that prices of a wide variety of products that they purchase have continued to increase through April, the next chart, suggesting that more increases in goods prices are in the pipeline. Once the impact of both tariffs and the oil shock on prices has been completed, this contributor to inflation should draw to a close.
ISM Prices Index
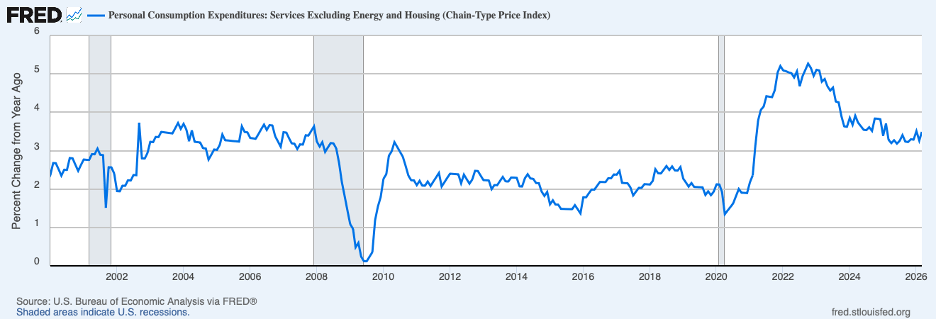
A better indicator of ongoing inflation pressures is service prices, the broken-green line in the chart above, as they are affected less by the recent tariff and oil shocks. PCE service price inflation ticked up to 3.4 percent in March. Because the housing component of PCE service prices may have been distorting underlying trends in service prices over recent years, the next chart excludes the housing (and energy) components of service prices and may be the most accurate measure of underlying inflation. This measure of service price inflation rose to 3.5 percent in March, up 0.2 percent from a year earlier and up nearly 1-1/2 percentage points from the decade leading up to the pandemic in 2020.
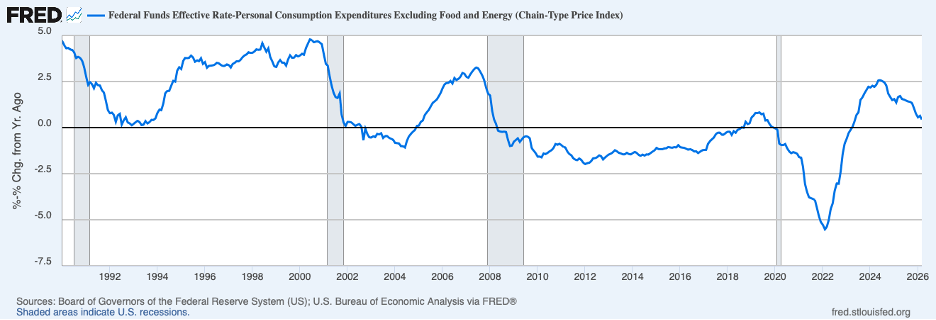
Summing up the recent evidence on inflation: once special factors that have been buffeting consumer prices are stripped away, underlying inflation has not shown signs of slowing over the past year. Steady, above-target inflation would suggest that Fed policy is not placing restraint on inflation. The chart below shows a measure of the real federal funds rate through March (the nominal federal funds rate less the twelve-month percent change in the core PCE). It was only 0.4 percent in March, at least one percentage point below the neutral rate (the interest rate at which monetary policy is neither expansionary nor contractionary). While the current target range for the federal funds rate would be close to neutral if inflation were close to the 2 percent target, it is hard to escape the conclusion that current Fed policy has been accommodative.
In these circumstances, underlying inflation pressures cannot be expected to moderate. Moreover, the longer above-target inflation persists, the more ingrained it will be and the more difficult will be the job of bringing inflation down. The European countries are coming to recognize that monetary policy tightening will be needed to get their inflation lower, and Japan is already in a policy tightening phase. In contrast, the political dynamics in the United States, as Fed leadership changes, are such that tightening in the United States is off the table at least for a while. In the meantime, it will be convenient to blame persistent inflation on one-off shocks that just need more time before they are gone.
Header image: Matthew Hamilton / Unsplash
