
The time for Fed liftoff—the first step in raising the policy interest rate—has gotten a lot closer. In August 2020, the Fed specified that liftoff would begin once three conditions were met: inflation reached 2 percent; inflation was projected to be moderately above 2 percent for some time, and its maximum employment mandate had been met. At that time, inflation had been running persistently below 2 percent and the outlook was that it would be quite some time before it was on a path to exceed 2 percent. Moreover, considerable slack remained in the labor market judging from the unemployment rate which had just reentered the single digits. The Fed also noted that it will complete its large-scale asset purchase program (tapering) before it begins liftoff.
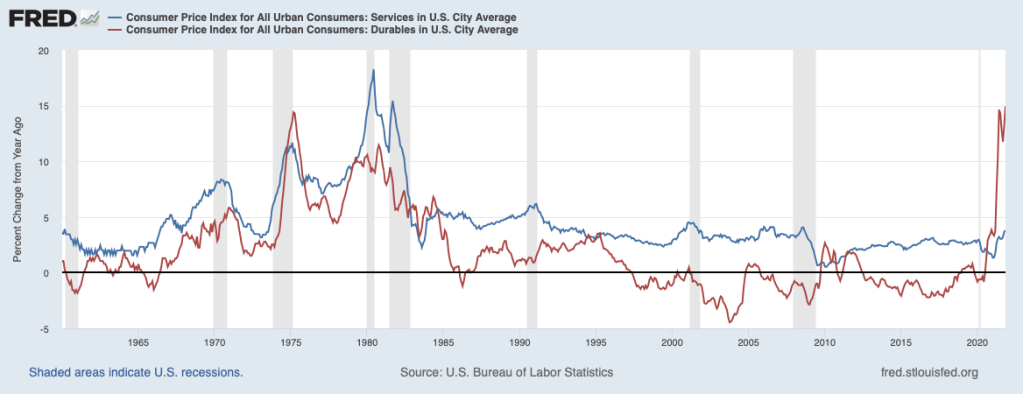
The situation has changed dramatically since August 2020. Inflation has soared. The chart below shows that the headline CPI rose nearly 7 percent over the twelve months ending in November while the core CPI (which excludes volatile food and energy prices) rose 5 percent. Increases in this order were last seen more than thirty years ago. The next chart shows that the prices of services have turned up in the past year but are still are inside the range of recent decades. In contrast, prices of durable goods are rising at a pace not seen in the post-WWII period.
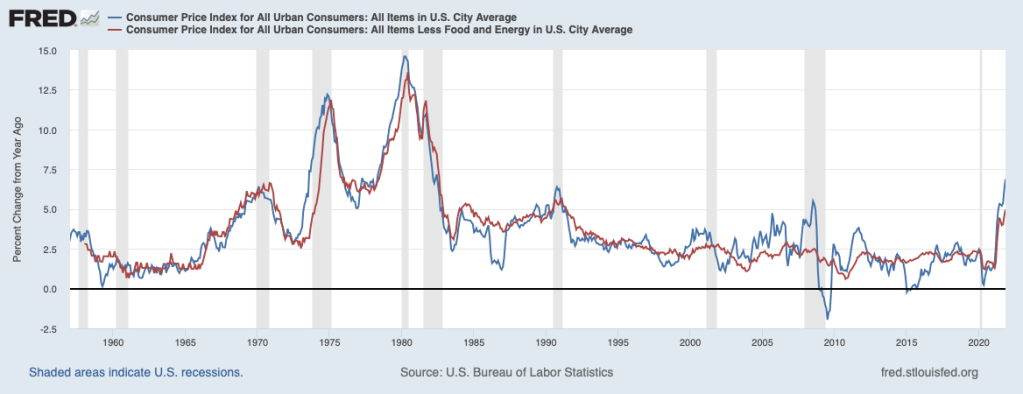
Thus, the first two conditions—inflation rising to 2 percent and on track to run above 2 percent—clearly have been met for liftoff.
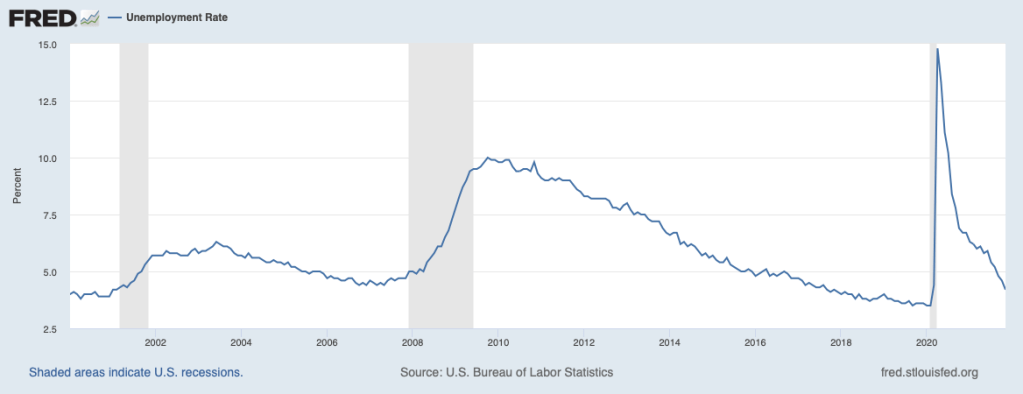
At issue is whether the third condition—maximum employment—has been met. Unfortunately, we do not have a single metric that tells us when maximum employment has been reached. The Fed and many others have focused primarily on the unemployment rate. The unemployment rate dropped to 4.2 percent in November, down markedly from the April 2020 peak of 14.8 percent. The unemployment rate in November was close to the rate that the Fed deems to be consistent with maximum sustainable employment—4.0 percent.
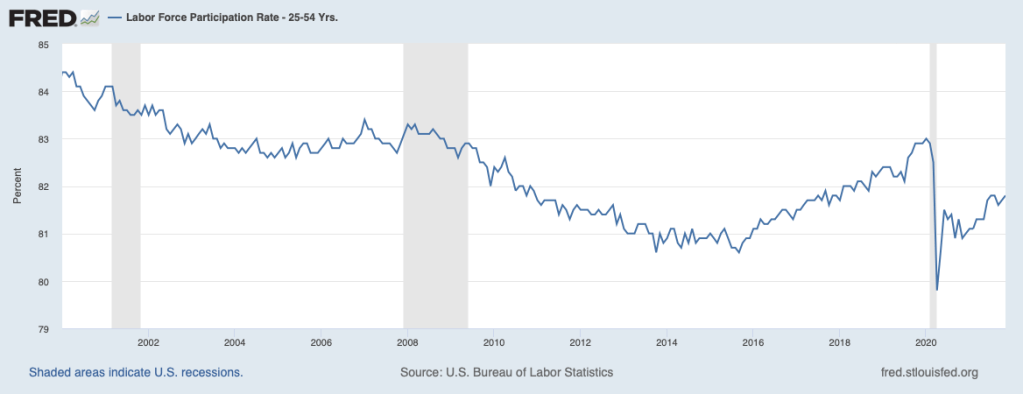
At times this measure may conflict with other indicators of the labor market. One key such indicator is the labor force participation rate, shown below for prime-age workers. The participation rate dropped sharply at the onset of the pandemic as a large number of workers left the labor force. Typically, in economic downturns, these departures from the labor force are owed to workers being discouraged about finding another job. However, this time, many left for COVID-related reasons—to avoid being exposed to the virus, to care for or to school children, to care for parents, or to take advantage of generous COVID-related transfer payments that make it more affordable not to work. The chart shows that the participation rate has recovered only about half of its spring 2020 decline. Some have viewed this partial recovery as an indication that slack remains in the labor market. To the extent that the nontraditional factors—very generous transfer payments and COVID adjustments—are still at work, it would seem unreasonable to expect the participation rate to return to pre-COVID levels. Furthermore, those pre-COVID levels likely were unsustainable as they were driven by the unusually hot labor market at the time.
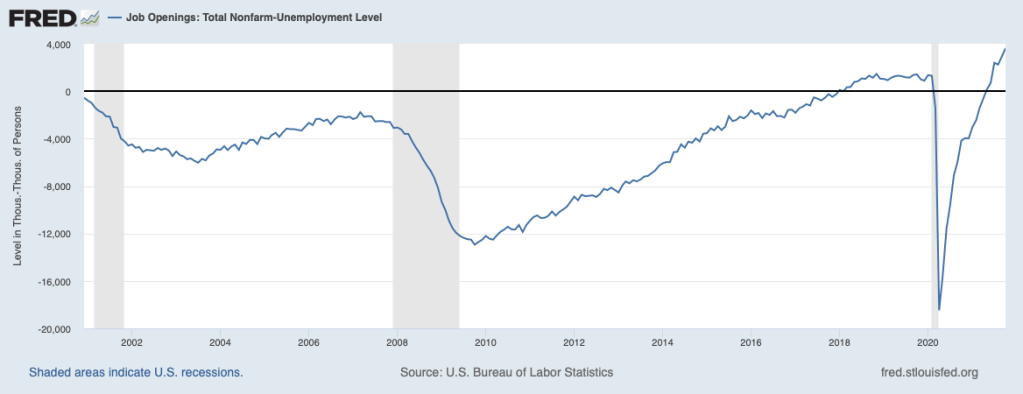
Other indicators of the labor market point more clearly to a tight labor market. Job openings are at record levels and the chart below illustrates that the excess of job openings over the number of unemployed persons recently has moved further upward into record territory.
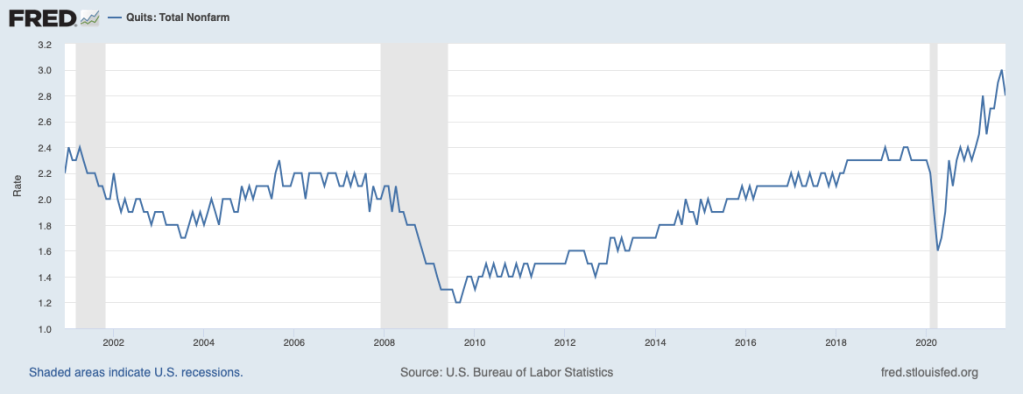
Also in record territory has been the quit rate, shown in the next chart. People typically quit jobs when they are confident that they can find a better job. This evidence suggests that awareness of a strong labor market is widespread among workers and they are acting on it.
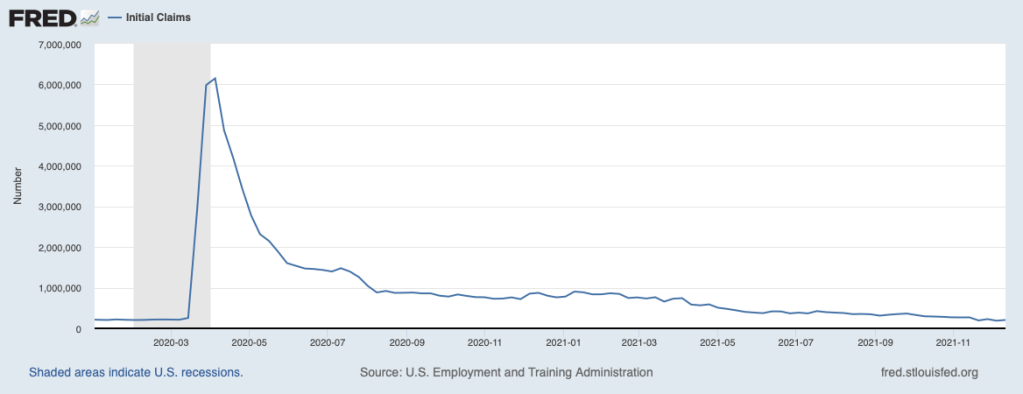
Initial claims for unemployment insurance are telling a similar story. Claims have retraced nearly all of the pandemic-caused spike and have returned to levels that have been associated in the past with a strong jobs market.
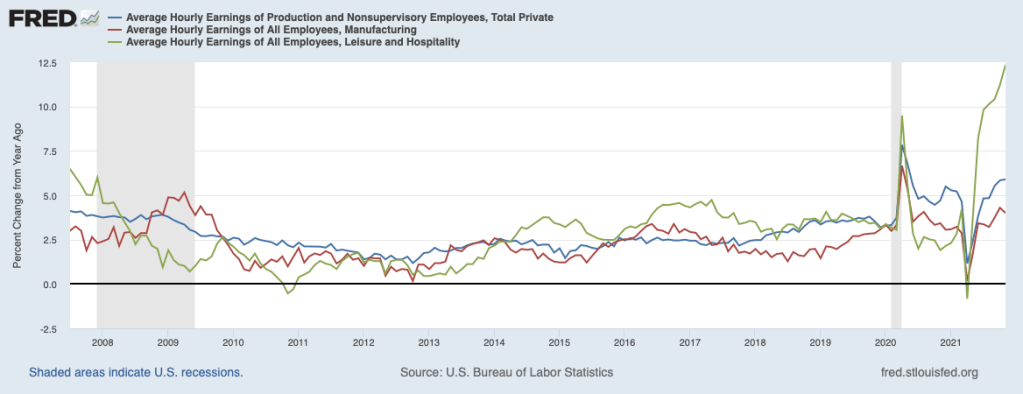
Strains in the labor market are further indicated by wages. Shown in the next chart is the twelve-month change in average hourly earnings for all production and nonsupervisory workers in the private sector (the blue line), for manufacturing workers (the red line), and leisure and hospitality workers (the green line). All three have picked up appreciably over recent months and are near or above their fastest pace in the past decade or so, especially in the leisure and hospitality sector. Moreover, surveys of employers indicate that we can expect more of the same in the coming months. For example, in the most recent survey of small businesses (for November) by the National Federation of Independent Businesses (NFIB), the proportion of respondents that intend to raise compensation in the next three months remains at a record (32 percent).
Looking at the various labor market indicators overall, a fair reading would suggest that maximum employment has been achieved and the labor market is on the verge of overheating. The Fed, however, has a little different take on the maximum employment issue. In its December 15 statement, the Federal Open Market Committee (FOMC) said, “With inflation having exceeded 2 percent for some time, the Committee expects it will be appropriate to maintain this target range (for the federal funds rate) until labor market conditions have reached levels consistent with the Committee’s assessments of maximum employment.” In other words, it would be premature to begin liftoff because the economy has yet to achieve maximum employment.
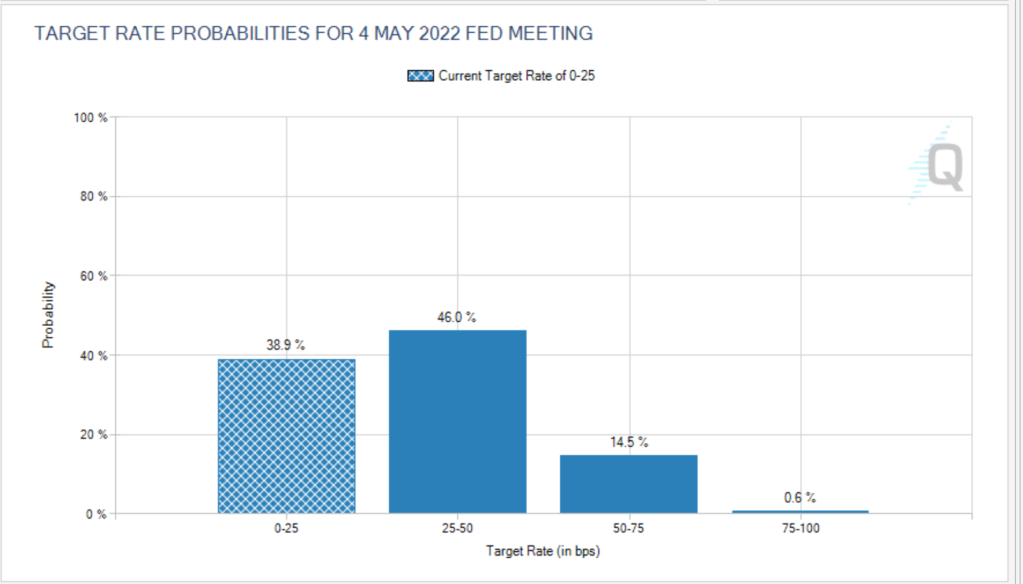
As noted, the Fed has said that it would not begin liftoff until it had completed its asset purchase program. In its December 15 statement, the Fed scaled back its asset purchase program sufficiently to end asset purchases altogether by the end of March 2022. Also, it foresaw that it would be raising its target for the policy interest rate (the federal funds rate) by 75 basis points over the course of 2022, up from 25 basis points in its previous forecast in September. Participants in the futures market for federal funds foresee the first rate hike taking place at the monetary policy meeting immediately after the end of March, scheduled for the beginning of May. This is shown in the next chart. These participants see the chances of at least a 25-basis point rate hike by May as roughly 60 percent, with some chance that the rate hike will be larger.
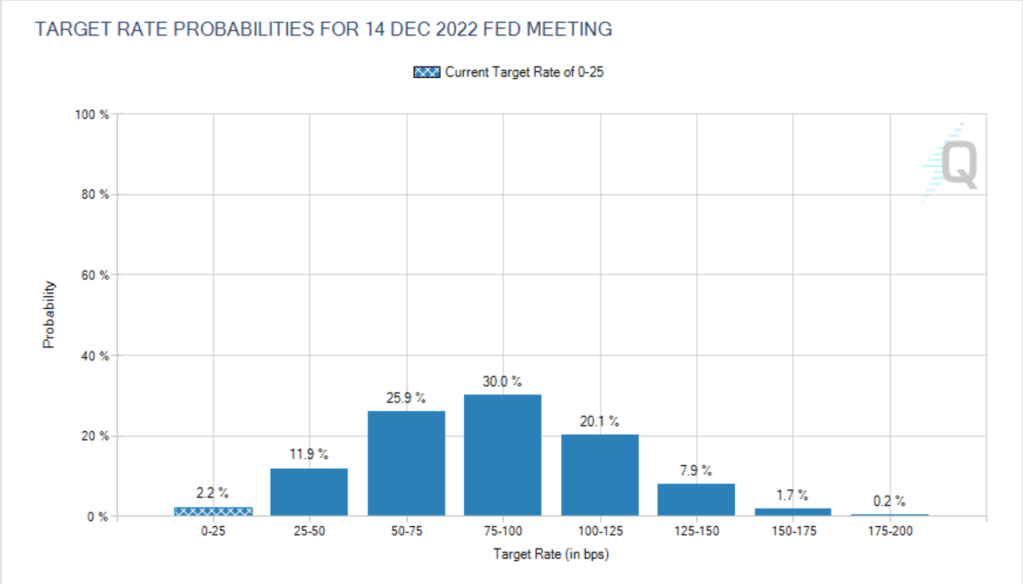
The next chart shows expectations by market participants for the federal funds rate at year-end 2022. Market participants see the odds of rate hikes that amount to less than 75 basis points as 40 percent but also the odds of greater hikes as 30 percent. These rate expectations are broadly consistent with those of the Fed.
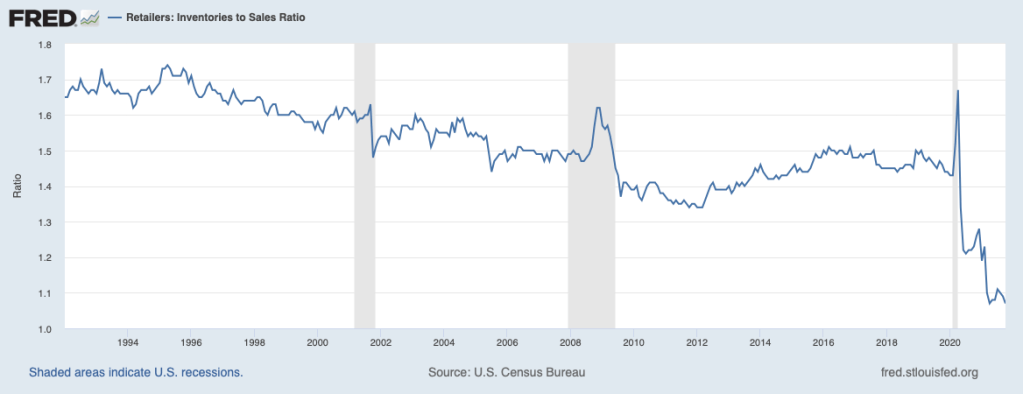
Inflation at this point has been building momentum. Contributing to that momentum have been ongoing supply chain disruptions as well as difficulties in getting workers to come back to the labor force. The next chart—depicting the inventory-sales ratio for the retail sector—shows that retail inventories have been depleted by supply chain disruptions and there has been little improvement over recent months. Furthermore, it appears that supply-chain disruptions are going to take the better part of another year or longer to be worked through. Similarly, it appears that under current circumstances workers choosing to sit on the sidelines are unlikely to be returning to the labor force.
With these restraints on supply and very strong pent-up demand, it is difficult to envision inflation easing to the Fed’s 2 percent target without more aggressive tightening by the Fed than what it projects. A considerable amount of evidence suggests that inflation momentum is hard to break. This inflation momentum is underscored by the widespread evidence that longer-term inflation expectations have moved upward and outside the range consistent with the Fed’s 2 percent inflation target (see November 19, 2021, commentary, Inflation: Is It Really Transitory?). It is hard to avoid the conclusion that we are going to be dealing with inflation and rising interest rates for some time to come. Meanwhile, expect some volatility in financial markets.
