At the late-January FOMC meeting, the Fed acknowledged that it had fallen behind the curve on inflation and would likely take more aggressive tightening actions than forecast in December to bring inflation back under control. In mid-December, the target for the federal funds rate was 0 to 25 basis points (also the current target), and the Fed predicted that it would be raising that target by 75 basis points over 2022 and another 75 basis points over 2023, followed by smaller increases until the federal funds rate reached 2-1/2 percent. The Fed also had the following forecast for inflation (based on its preferred Personal Consumption Expenditures index, different from the more common Consumer Price Index):
| Forecast date | 2021 | 2022 | 2023 |
| December 2021 | 5.3 | 2.6 | 2.3 |
| December 2020 | 1.8 | 1.9 | 2.0 |
| Actual | 5.5 |
The second column of the table shows that the outcome for inflation in 2021 (5.5 percent) turned out to be considerably above what was forecast at the end of 2020 and even above what was forecast at the end of 2021. It is no understatement that the jump in inflation in 2021 caught the Fed by surprise.
The Fed in December also forecasted a sharp deceleration in prices in 2022—to 2.6 percent. In other words, the Fed was thinking that its raising of the federal funds rate moderately over 2022 would be sufficient to bring inflation down to 2.6 percent in 2022—not far above its target of 2 percent. The arithmetic is such that to get to this outcome monthly increases in consumer prices would have to average 0.23 tenths of a percentage point, less than half the pace of the final four months of 2021. This amount of deceleration does not seem plausible absent much sharper increases in the federal funds rate.
Some of the easings of inflationary pressures expected by the Fed were thought to come from a relieving of temporary (transitory) strains on resources, notably from supply chain disruptions and from a reluctance of workers to reenter the labor force. At this point, it seems highly unlikely that relief will come from either of these factors in the near term. The chart below presents an index of global supply chain pressures.
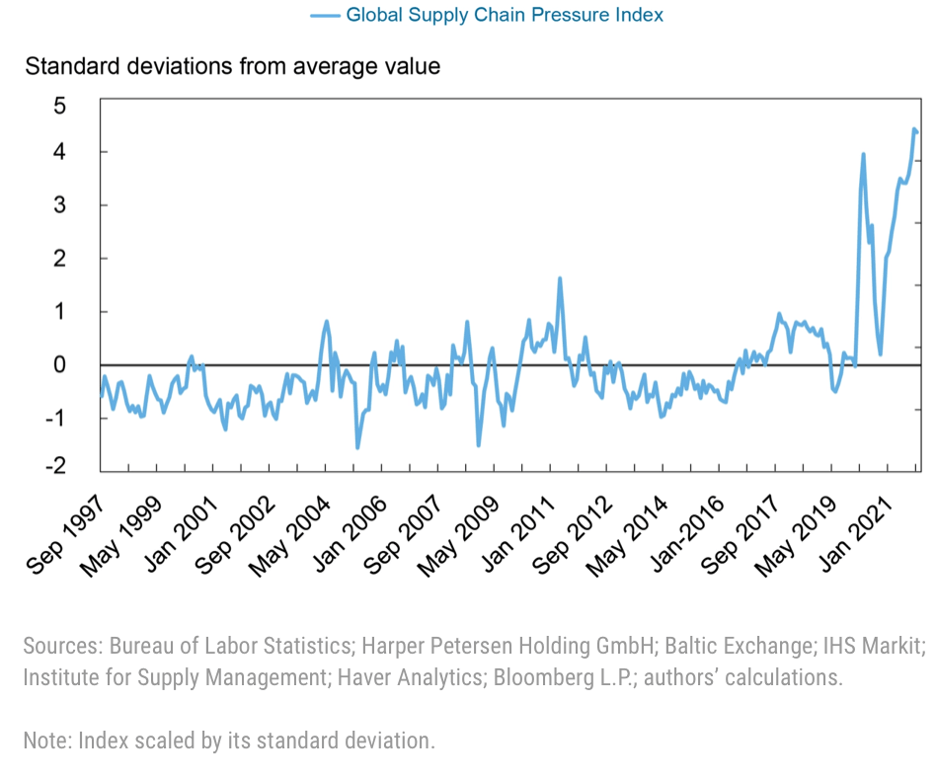
The index is prepared by the Federal Reserve Bank of New York. The chart shows that supply chain pressures over the past two years have been considerably more intense than anything experienced over the past quarter-century. Moreover, they are not abating. Thus, the impact of supply chain disruptions on inflation will continue to be with us for the foreseeable future.
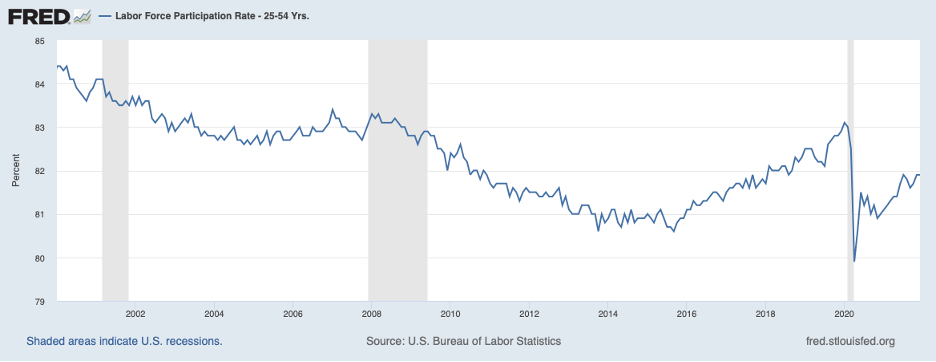
Turning to restraints on labor supply, the next chart presents the labor force participation rate (LFPR) on the part of prime-age workers. The LFPR had been on a downward trend from the early 2000s until 2016 owing largely to more generous government transfer payments and a growing share of the workforce qualifying for disability payments. Beginning in 2016 the very strong jobs market drew people off the sidelines and the LFPR turned up until the eve of the COVID shock in early 2020. No doubt the peak in the LFPR at 83 percent in February 2020 was unsustainable and the LFPR would have declined somewhat, even in the absence of COVID. However, the COVID shock caused a sharp drop in the LFPR that was followed by only a partial recovery. Over recent months, the LFPR appears to have stabilized around 81.9 percent. Prime age persons give as reasons for less participation their concerns about getting COVID in the workplace, the need to care for parents, the need to school children, and more ample transfer payments (such as child tax credits).
Difficulties in getting workers to return to the workforce have placed considerable pressure on worker compensation and employer costs, as seen in the next chart. Compensation for all employees in the private sector (blue line) picked up considerably throughout 2021. The pickup was especially sharp in sectors facing the most difficulty getting workers—transportation (the red line) and accommodations and food services (the green line). This upward pressure on compensation is leading to faster increases in consumer prices. Historical experience suggests that labor force participation is unlikely to return to pre-pandemic levels, at least for some time. Meanwhile, limitations on labor supply are going to add to price increases.

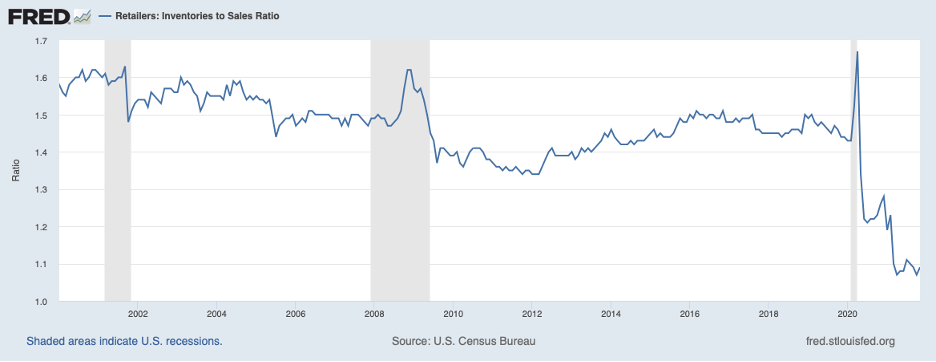
Another factor that will be placing upward pressure on prices is lean inventory positions, especially at the retail level. Shown below is the level of retail inventories in relation to sales. Lack of inventory contributed to declines in purchases by consumers of both durable and nondurable goods over the last two months of 2021. With retailers attempting to rebuild inventories—and create a larger cushion than they had previously—more strains will be placed on producers of goods and the prices that they will be charging until the building process has been completed.
Thus, supply chain pressures, labor shortages, and inventory rebuilding will be contributing to inflation over the months ahead. Even once these forces fade, higher inflation will persist, absent vigorous tightening by the Fed.
The evidence from inflation in the United States clearly demonstrates that once higher inflation gets underway, it becomes persistent and stubborn to slow. Some of this momentum stems from higher expectations of wage and price inflation that become entrenched. But there appears to be more at work in the dynamics of the inflation process that contributes to persistence. In the late 1970s, inflation reached double digits and the Fed responded with a very restrictive policy under which the federal funds rate reached nearly 20 percent and the mortgage rate 18 percent. It took three years of this intense monetary policy restraint to bring inflation down below 5 percent. For much of this period, the unemployment rate hovered in the 10 percent region. Statistical models show that slack in the economy (high unemployment) and declining inflation expectations cannot explain all of the persistence of inflation during this period. Something else was contributing to the stubbornness of inflation to come down.
Fortunately, the current situation is not as severe as the late 1970s, and it will not take such draconian monetary tightening measures to bring inflation under control. But the Fed will need to begin raising the federal funds rate soon and be prepared to raise it well above the so-called neutral level of around 2-1/2 percent—the level at which monetary policy is neither expansionary nor contractionary. The next chart shows market expectations for Fed rate moves over the next year. The chart shows that market participants foresee roughly a 70 percent chance that rate hikes will accumulate to 125 basis points or more over the next year. To get to that amount, the Fed would have to raise the target for the federal funds rate by 25 basis points at five or more of its eight scheduled meetings over this period.

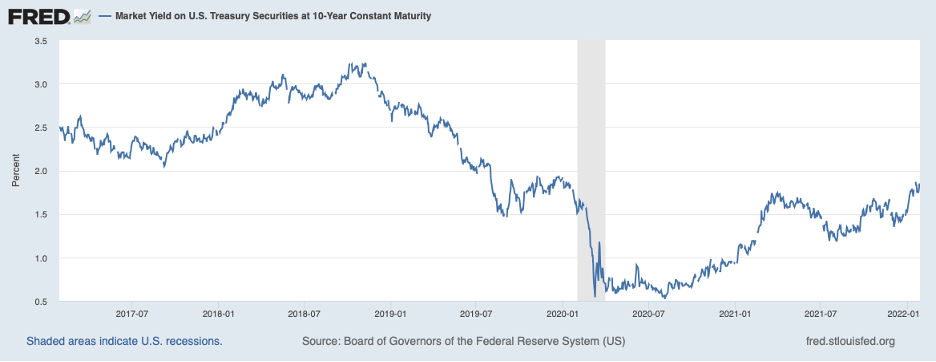
A big question is whether rate hikes amounting to 125 basis points over the next year will be sufficient. If the federal funds rate were to reach 125 basis points in another year, that would still leave another five rate hikes of 25 basis points each to reach the neutral federal funds rate at which monetary policy is no longer accommodative—that is, the point at which Fed policy is no longer adding to inflationary pressures. For Fed policy to become disinflationary, the federal funds rate will need to rise above 2-1/2 percent and probably well above. At the pace of rate hikes that the market is contemplating currently, the Fed will not be making progress in placing inflation on a trajectory to reach the 2 percent target. If the Fed is indeed serious about bringing inflation under control, get ready for a series of interest rate hikes in the period ahead—perhaps some as much as 50 basis points. As the higher trajectory for the federal funds rate comes to be realized by market participants, other interest rates—such as the yield on the benchmark ten-year Treasury note (shown below)—will be rising a good bit further before they reach their peak.