
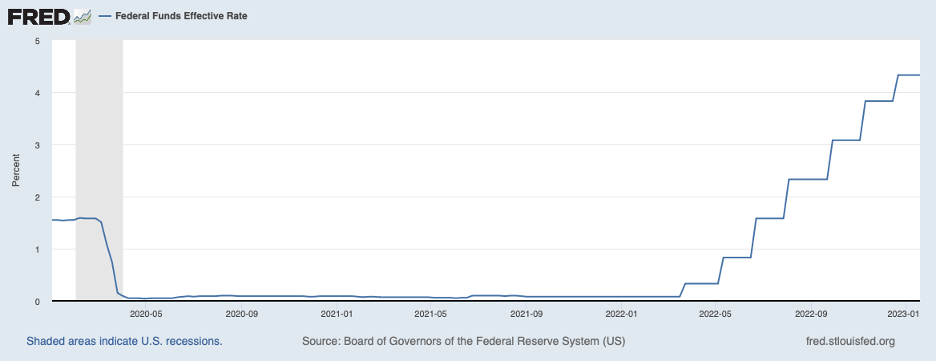
The decisions facing the Fed are getting more difficult. A year ago, persistently high inflation readings made it clear that the Fed was way behind the curve in getting control of inflation and there was consensus that aggressive tightening was needed. In response, as shown in the chart below, the Fed raised its target for the federal funds rate at seven of its eight meetings in 2022. Four of those increases were 75 basis points. The Fed slowed the pace at the end of 2022 to 50 basis points in mid-December. And there seems to be a growing consensus among Fed policymakers that they should be slowing the process further—to 25 basis points.
In December, the Fed conveyed that it anticipated rate hikes in 2023 accumulating to 0.75 percent. At the time, a federal funds rate of around 5 percent was viewed by the Fed to be sufficient to place inflation on a downward trajectory toward the Fed’s inflation target of 2 percent. Indeed, the Fed’s December projections envisioned the target for the federal funds rate drifting lower over 2024 and 2025, ultimately to 2.5 percent which would be neither contractionary nor stimulative at an inflation rate of 2 percent.
Implied by the Fed’s projections is a neutral real federal funds rate—one that is neither contractionary nor stimulative—of 0.5 percent (derived by subtracting the expectation for inflation—2 percent—from 2.5 percent). In the Fed’s projections, underlying inflation starts to come down in 2023 and continues to move lower in subsequent years, enabling the Fed to begin lowering its target for the federal funds rate in 2024 towards 2.5 percent.
In these circumstances, the Fed envisioned output growth being tepid in 2023 and 2024, slow enough for unemployment to increase from its current 3.5 percent rate to the 4.5 percent area—moderately above the 4.0 percent rate thought to be consistent with maximum sustainable employment conditions (the so-called natural rate of unemployment). This scenario borders on a mild recession.
Inevitably, the economy and inflation will not unfold as the Fed has forecast. As a result, the Fed will need to alter the trajectory of the federal funds rate. Basically, the Fed will be judging whether they have raised the federal funds rate sufficiently to place underlying inflation on a downward path to 2 percent.
A good place to start in assessing where the Fed is likely to be in error is to look at the real federal funds rate in relation to the neutral rate of around 0.5 percent or possibly higher. The next chart shows a measure of the real federal funds rate through November 2022 (based on core PCE inflation which is available only through November). In November, the real federal funds rate was negative and a good bit below 0.5 percent. If the line in this chart were extended through the end of December, the real federal funds rate would draw closer to zero owing to the 50 basis point hike in the federal funds rate at mid-month and perhaps a small slowing in underlying inflation in December.
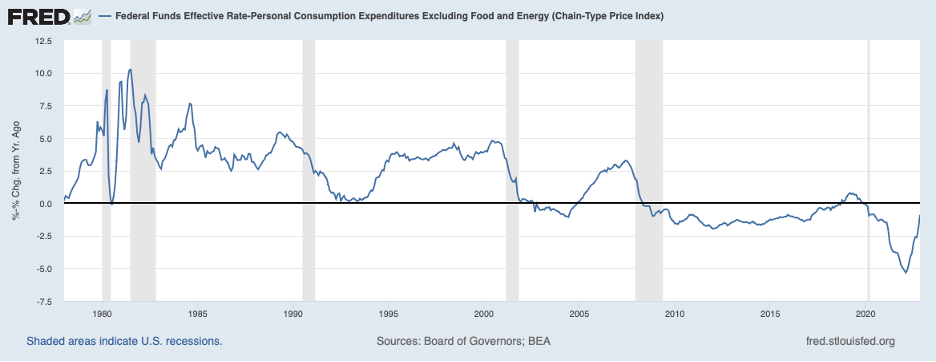
However, a real federal funds rate of zero is still stimulative, not restrictive. The real federal funds rate has to rise a good bit further before it is sufficiently restrictive to place underlying inflation on a downward path toward the Fed’s announced goal of 2 percent. In other words, the nominal federal funds rate will need to rise a good bit higher than the Fed’s December projection of around 5 percent.
In contrast, there are those both inside and outside the Fed who have come to the view that Fed tightening has only a little further to go before it has achieved its goal. Policy tightening has led to notable cooling in the housing sector and slowing growth of consumer spending; based on this evidence, many observers have come to conclude that the Fed has done enough tightening and a recession is looming. If indeed a recession is imminent, the above analysis of the real federal funds rate suggests that the recession is not being brought on by monetary policy. Rather, in such an event, the recession would owe to a negative shock to aggregate demand.
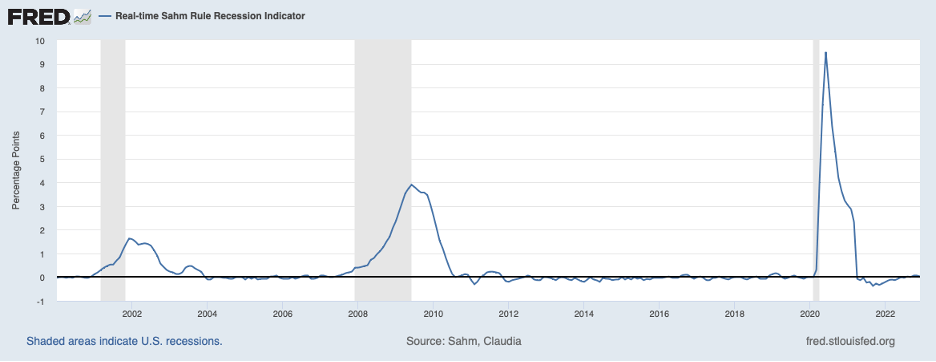
Statistical models that predict recession are giving trivial odds that a recession is just around the corner, as shown in the chart below. The model used for this chart is based on the unemployment rate through December 2022.
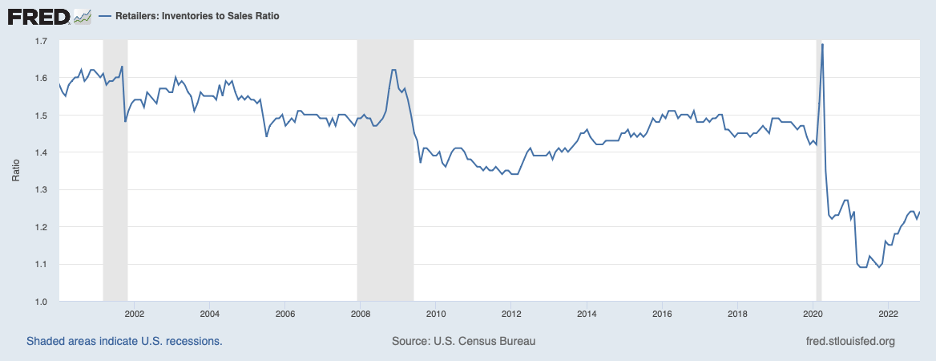
Although recent data on the housing sector and consumption—accounting for more than 70 percent of aggregate demand— have been soft, business investment in inventories is likely to augment other components of demand going forward. The next chart shows that retail inventories in relation to sales remain very low and retailers can be expected to rebuild their stocks back to more comfortable levels.
In addition, businesses have been adding to their orders for capital goods and the level of unfilled orders for capital goods (excluding the highly volatile aircraft sector) has been reaching new highs which will also be giving a lift to aggregate demand in the period ahead.

The December 2022 CPI data were viewed by market participants as confirming that Fed actions to date are succeeding in lowering inflation. Headline inflation, the blue line in the chart below, slowed 0.7 percent to 6.4 percent, its smallest increase in more than a year. Meanwhile, core inflation, the red line, fell for the third consecutive month to 5.7 percent. On balance, the deceleration in both CPI measures was a little better than market participants had expected and, in response, they revised down their projections for the path of the federal funds rate. Market participants now foresee the federal funds rate increasing to 4.75 percent in the spring of this year and the Fed starting to lower the federal funds rate some months later—in the fall.
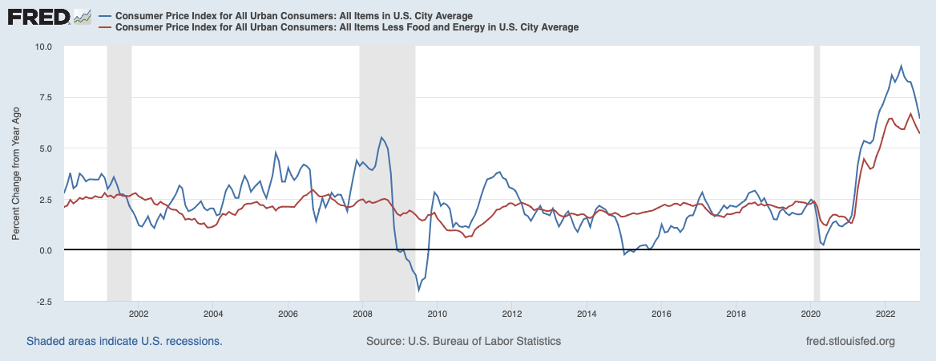
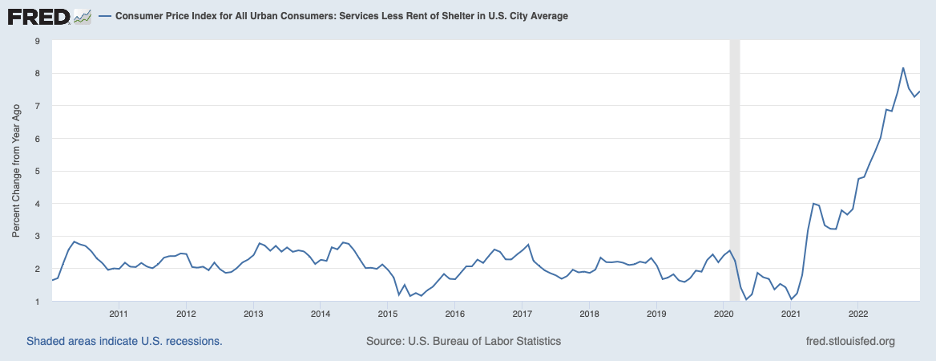
Looking more closely at the December CPI data, both headline and core measures of inflation have benefitted from ongoing declines in commodity prices that have retraced previous large increases caused mostly by supply-chain disruptions (see January 8, 2023 post, “The Inflation Fight: Where Are We Now?”). These forces will be dissipating in the coming months at which point commodity prices can be expected to resume increasing. Moreover, housing service price inflation—rent of shelter—is expected to slow a good bit in the coming months in part owing to technical reasons related to the methodology used in constructing this component of the CPI. In light of these circumstances, service prices excluding rent of shelter—the next chart—is probably a better measure of underlying inflation at present. This measure of inflation remains elevated and has yet to show much evidence of slowing. Thus, it seems premature to declare that Fed policy to date has been successful in breaking the back of inflation.
In sum, Fed policy has yet to become restrictive, as suggested by the real federal funds rate. Moreover, the absence of restraint is confirmed by CPI data for services even as the more commonly followed measures—headline and core inflation—hint that the job of bringing inflation down is largely finished. Some have expressed concern that because of lags in monetary policy, the Fed must be cautious in raising the federal funds rate further and avoid overdoing monetary restraint, an argument that may apply to some time in the future but not in the current period. Because policy has been stimulative to date, the presence of lags implies that the impact of monetary policy on the economy continues to be stimulative—though less so than before rate hikes began. This analysis implies that if the Fed moves policy into a sufficiently restrictive position to return inflation to 2 percent on a sustained basis, that policy will also bring on a recession.
