
Discussion recently has focused on higher interest rates and has been accompanied by discussion of unusual behavior of short-term versus long-term interest rates. Much attention was given to the decrease in short-term rates and increase in long-term rates after the most recent FOMC meeting ending on July 29 (the yield on the two-year Treasury note declined 4 basis points while the yield on the ten-year rose 6 basis points and the yield on the thirty-year bond rose 11 basis points). What can account for such diverse behavior of short- and long-term rates? Can long-term rates be expected to come back down?
For starters, it is helpful to note that both short-term and long-term interest rates are composed of an average of overnight interest rates expected over the term of the instrument — 91 days for a three-month Treasury bill and roughly 3,650 days for a ten-year Treasury note. In addition, each rate includes a term premium that generally increases with the maturity of the instrument and compensates investors for greater price risk as maturity increases. Viewed from this perspective, a decline in short-term rates coupled with an increase in long-term rates on July 29 implies that expectations for the overnight rate in the near term were revised downward while expectations for the overnight rate over the longer term were revised upward — by more.
It is further helpful to note that nominal interest rates — the rates we usually follow — contain a real interest rate component for that maturity and an expected inflation component (an average of expected inflation over the period of the instrument). Thus, an increase in the nominal yield can reflect either higher expected real rates or higher expected inflation. The increase in the nominal ten-year yield (and yields on other long-dated Treasury securities) on July 29 was viewed by analysts as market participants coming to expect higher inflation in the future owing to less likelihood that the Fed will take action to restrain inflation by raising its policy interest rate in the near term. For example, expected inflation over the five-year period starting in five years, shown in the next chart, rose after the July 29 announcement and now is about 10 basis points higher than on the eve of the announcement.

Currently, the U.S. economy has a head of steam, propelled by the AI buildout — IT hardware, software, data centers, electric power plants, and AI research and development. This buildout is putting a lot of pressure on resources and putting upward pressure on many prices and crowding out other sectors of the economy, such as residential construction.
Real private final domestic purchases — investment and consumption — grew at a brisk 2-3/4 percent annual rate over the first half of 2026 and early indicators for the third quarter do not point to a slowing. In these circumstances, interest rates need to be higher across the maturity spectrum to bring growth in aggregate down in relation to growth in aggregate supply and to contain inflationary pressures. When tightening has been expected by market participants and the Fed leaves rates unchanged, nominal shorter-term rates can be expected to fall and longer-term rates to rise, as they did on the announcement and press conference on July 29.
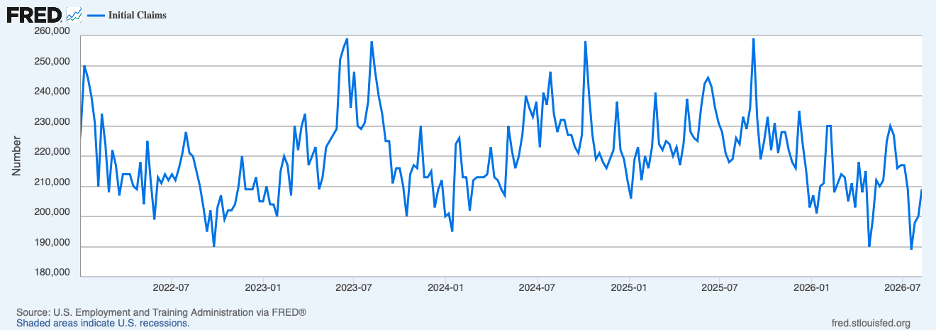
Recent data has been seen by market participants as having a softer edge — notably the employment and retail sales reports for July. In response, interest rates have edged lower. However, the July decline in total nonfarm employment owed to sizable declines in government employment (mostly public education workers). Private employment has held up better and has averaged 72,000 per month in 2026, up from 25,000 per month in 2025. Moreover, initial claims for unemployment insurance, shown next, have continued to be very low, suggesting a low level of layoffs. (Hiring also has been low and it is plausible that the threat of AI displacing workers may be restraining wage growth, bolstering profit margins, and adding impetus to the stock market.)
Additionally, the July decline in retail sales can be attributed to lower fuel prices during the survey period and a timing change of a summertime annual sale by Amazon, the major online retailer.
Consumer price data for July were also seen by market participants as tepid and supportive of no change in the Fed’s policy interest rate (market participants now see the probability of a Fed rate hike in September to be near 50 percent, down from more than 80 percent on the eve of the last FOMC announcement). The core CPI increased 0.2 percent in July and was up 2.5 percent over the twelve months ending in July, as shown by the solid blue line in the chart below.
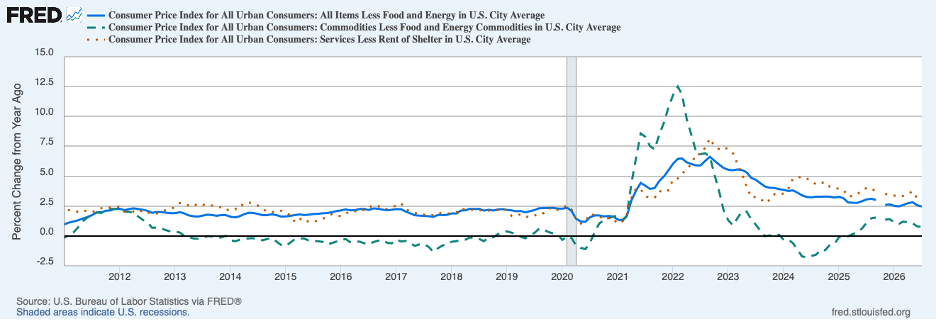
While the core CPI strips out volatile food and energy prices, it has been affected by swings in commodity prices — owing to volatile energy prices and the vicissitudes of on-and-off tariffs — and its rent of shelter component that has not tracked well with some other measures of housing costs. The dotted red line in the chart above removes rent of shelter from service prices and is likely a better indicator of underlying inflation at the current time than core inflation; the twelve-month change in this measure was 3.0 percent — down a little from recent months but still well above the 2.1 percent average rate over the period leading up to the pandemic in 2020. (The broken green line in the chart above shows twelve-month changes in core commodity prices which in recent months have been holding down core inflation.)
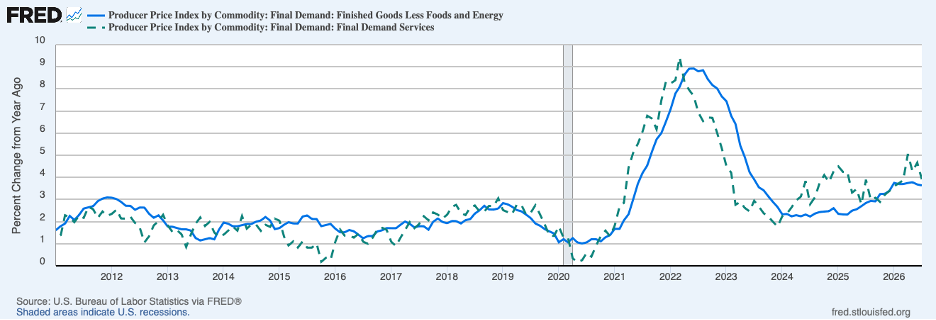
Service prices in the PPI, the broken green line in the next chart, are telling a similar story. The twelve-month change in service prices — at 3.9 percent in July — is the same as a year earlier and 2 percentage points above the rate preceding the pandemic.
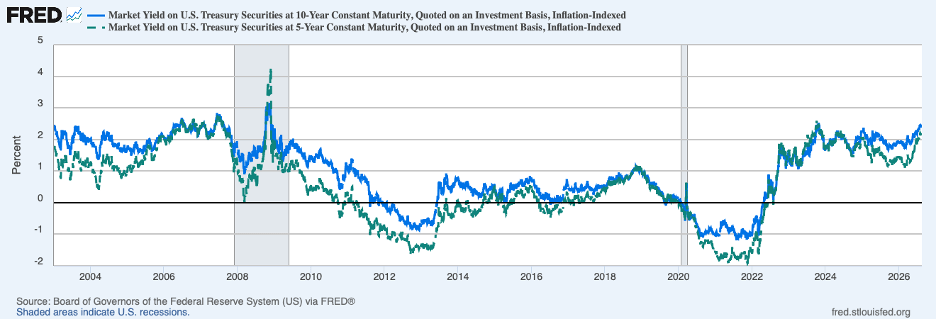
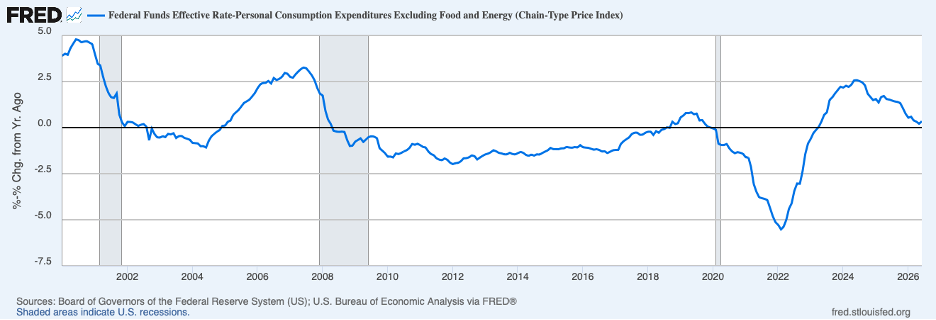
The evidence above suggests that the current stance of monetary policy is not as restrictive as many market participants perceive. In other words, the neutral real interest rate — the rate at which monetary policy is neither restrictive nor stimulative — likely is somewhat above the level widely believed. The chart below illustrates that the real five-year interest rate (broken green line) and the real ten-year rate (solid blue line) have risen a good bit lately and have returned to levels that prevailed before the financial crisis unfolded in 2008. Both exceed 2 percent and are well above the 1 percent rate that Fed policymakers have penciled in as the neutral rate (Fed policymakers have been writing down a real overnight rate and the figures in the chart are for longer rates which tend to be a little higher than overnight rates because of term premiums). The next chart presents an estimate of the current real overnight rate.
This rate is only 30 basis points, a good bit below any reasonable estimate of the current level of the neutral rate. This reasoning implies that continuing to stand pat on the policy rate is only delaying necessary action to restore price stability. Moreover, delay means even more aggressive tightening at some point in the future and more economic disruption will be needed to get to price stability.
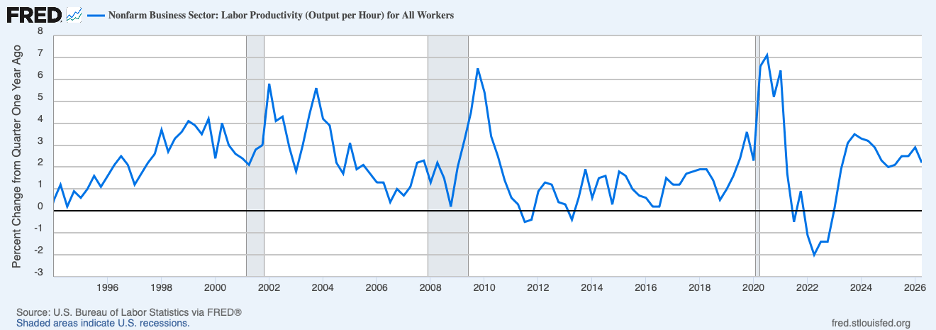
Regardless of Fed action on the policy rate in the near term, there are fundamental forces that are putting upward pressure on longer-term real interest rates — notably an upturn in growth in productivity and an unsustainable fiscal outlook. How these forces will affect nominal interest rates will depend on whether the Fed follows through on its promise to restore price stability; longer-term nominal interest rates will be higher if inflation continues to be elevated and market participants continue to mark up their expectations for future inflation.
The next chart illustrates that growth in labor productivity — output per hour — has picked up in recent years from the period preceding the pandemic. Productivity growth averaged 2.2 percent from the start of 2023 through mid-2026 and is likely to grow faster in the years ahead. (For comparison, productivity grew at a 3 percent annual rate over the decade starting in early 1996.) The primary driver of productivity growth will be the application of AI to many tasks that historically have been performed by employees. Business investment in AI has been growing in response to perceived very high returns on AI-related investments and has been moving down the food chain of businesses. Employers to date have been cautious in their application of AI to employee tasks. Nonetheless, the continuing prospect of high returns on AI-related investments will continue to place upward pressure on real interest rates as businesses scramble to raise funds to undertake such investments.
Turning to the budget, the federal budget outlook calls for ever-increasing borrowing and competition from the federal government for funds in credit markets. The table below shows the evolving picture for the federal deficit (the deficit is a negative surplus) and debt, both scaled by GDP.
Federal Budget and Debt
(As a percent of GDP)
| Budget Surplus | Debt Held by the Public | Memo: Net Interest | |
| 2000 | 2.3 | 33.7 | 2.2 |
| 2006 | -2.5 | 34.7 | 1.7 |
| 2016 | -3.1 | 76.0 | 1.3 |
| 2026 | -5.8 | 100.6 | 3.3 |
| 2036 | -6.7 | 120.2 | 4.6 |
| 2046 | -7.7 | 144.5 | 5.7 |
| 2056 | -9.1 | 175.1 | 6.9 |
At the start of the millennium, the nation had a budget surplus of 2.3 percent of GDP and a debt equaling 33.7 percent of GDP. By 2016, the surplus was replaced by a deficit (which represents the amount of borrowing by the Treasury) of 3.1 percent of GDP and a debt ratio of 76 percent. This year, the deficit is projected to climb to nearly 6 percent of GDP and debt held by the public now matches the size of GDP ($33 trillion). By 2056, borrowing by the Treasury is projected to reach 9 percent of GDP and debt held by the public is projected to soar to 175 percent of GDP. These projections imply that mounting federal borrowing pressures will persist in the years ahead and that real interest rates will need to remain high to crowd out private borrowing.
In sum, the era of higher real interest rates is here to stay. Fed policy cannot change the fundamentals determining higher real rates. However, the Fed can limit the level of nominal interest rates beyond the near term by getting inflation under control and convincing the public that stable prices are here to stay.
Header image: Kurt van Krieken / Unsplash


