
The 0.4 percent decline in the headline CPI in June, as energy prices fell, along with an unchanged core CPI (which excludes energy and food prices), has led some observers to conclude that price stability is now in sight. Indeed, June was the first time in six years that the core CPI did not increase. As we look beneath the surface, is it safe to conclude that the inflation problem is about to be in the rear-view mirror?
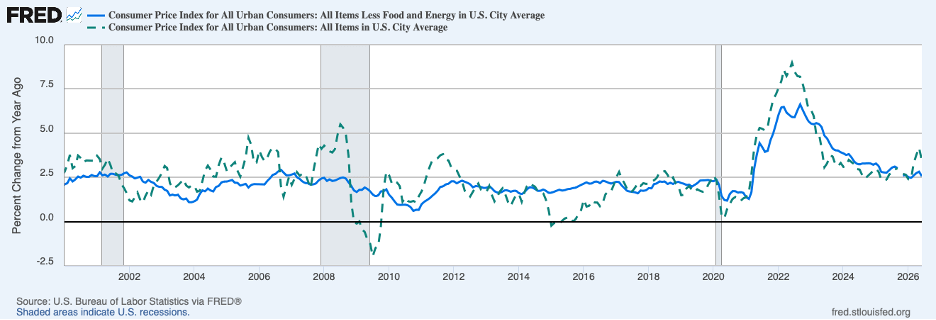
The chart below shows that the twelve-month percent change in core CPI prices, the solid blue line, slowed to 2.6 percent in June from 2.8 percent in May and 2.9 percent a year earlier. The twelve-month change in headline CPI prices, the dotted green line, dropped more dramatically to 3.5 percent in June from 4.2 percent in May. (The reversal of energy prices in July implies that headline CPI inflation will bounce back in July.)
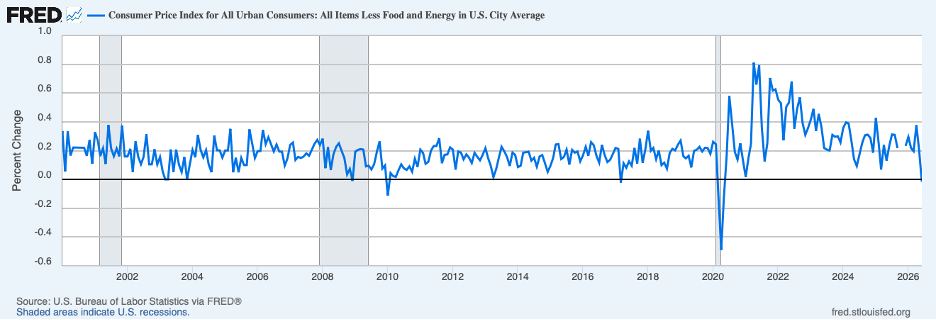
For starters, month-to-month changes in CPI data are volatile, as shown by the chart below for the core CPI. Large movements in one month are frequently reversed, at least in part, the following month. Thus, it will take additional months of good CPI readings before one can be confident that core inflation has moved lower.
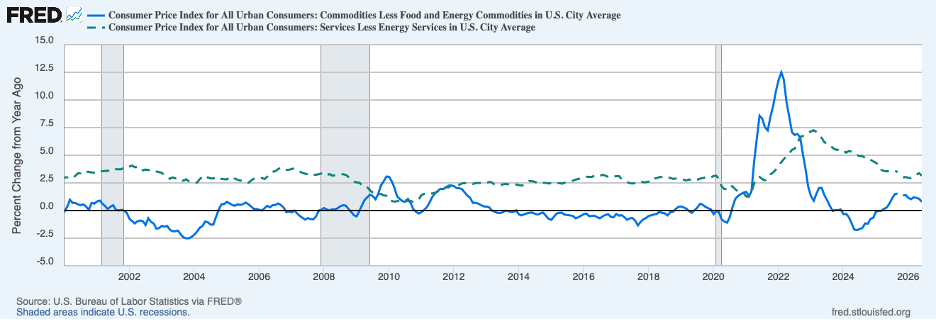
Turning to major components of the CPI, the next chart breaks out prices of core commodities (the solid blue line) from prices of services (less energy, the broken green line). Commodities price inflation, which had been boosted by tariffs, moderated a bit further in June to 0.8 percent on a twelve-month basis. Service-price inflation was 3.1 percent on a twelve-month basis in June, around where it has been since the end of 2025.
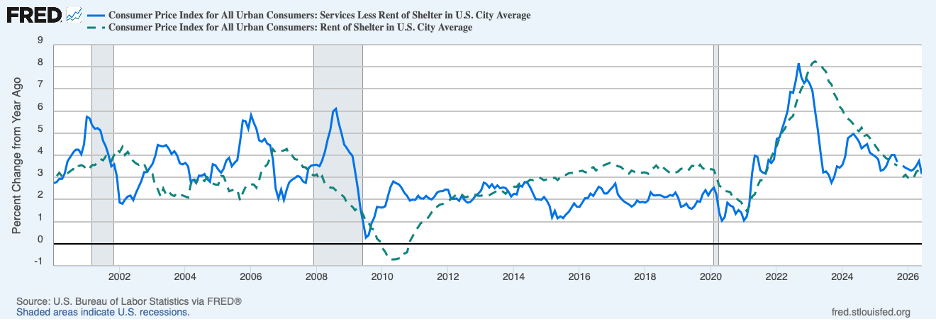
The next chart breaks down service-price inflation into its shelter component (dotted green line) and other services component (solid blue line). This measure of shelter inflation, which may not have been capturing actual housing costs faced by households in some recent years, appears to have leveled off. Inflation in other services, which has been less affected by special factors affecting commodities prices and measured housing costs, slowed in June; however, it remains in the range it has been in over the past three years, which is well above readings on this measure prior to the pandemic.
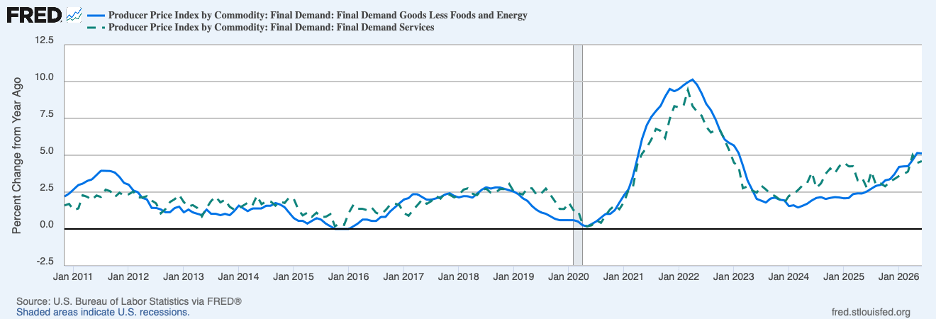
Going beyond the June CPI data to see if underlying inflation may be slowing, the next chart shows PPI twelve-month changes through June for final demand, core goods (solid blue line) and final demand, services (the broken green line). Both inflation measures edged higher in June, in contrast to their CPI counterparts, and have been on an upswing in recent months. PPI service-price inflation has averaged 4.2 percent over the first six months of 2026 — 2-1/2 percentage points above the average for several years leading up to the pandemic.
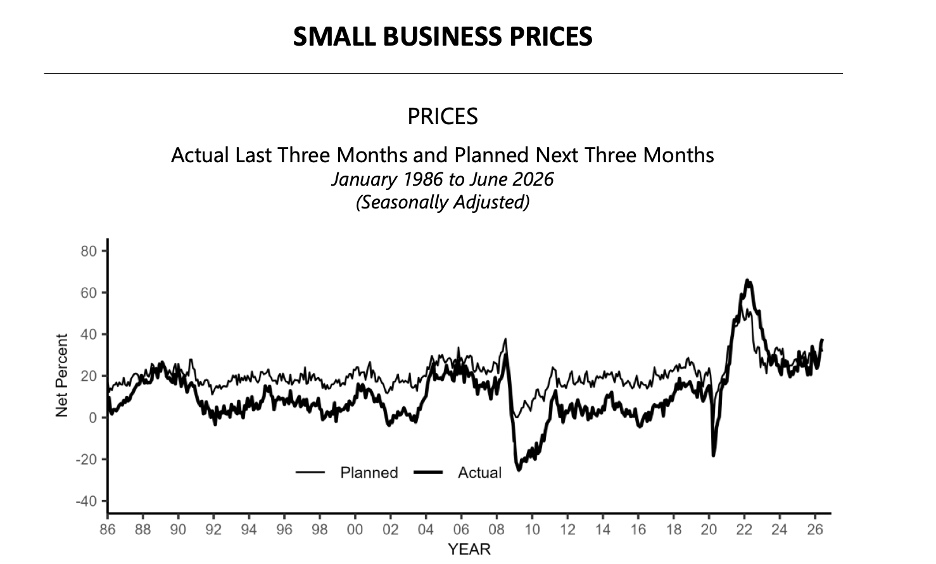
Still other evidence on inflation trends is found in the monthly NFIB survey of small businesses. The net percent of small businesses reporting that they raised prices over the three months ending in June, shown by the thick line in the chart below, was at the high end of where it has fluctuated over recent years. The net percent planning to increase prices over the next three months, the thin line, ticked lower in June but stayed at the high end of readings in recent years.
In sum, the June CPI release provided some hope that relief is coming from stubbornly high inflation. However, a more careful reading of the CPI and other evidence would call for caution in thinking that underlying inflation has started to drop.
The dynamics of the inflation process, especially the persistence factor, are not fully understood. Nonetheless, inflation has very corrosive effects on the economy, disrupting its performance in numerous ways. Not only does inflation cause capricious changes to income and wealth distribution, but it confounds price signals that play a critical role in directing resources to where they can provide the greatest value. When there is inflation, decision makers have more difficulty ascertaining whether a higher price is calling for a redirection of resources or whether the higher price reflects a broad increase in price pressures (inflation). In view of its insidious effects, inflation needs to be under control before the economy can be expected to fully realize its potential on a sustained basis.
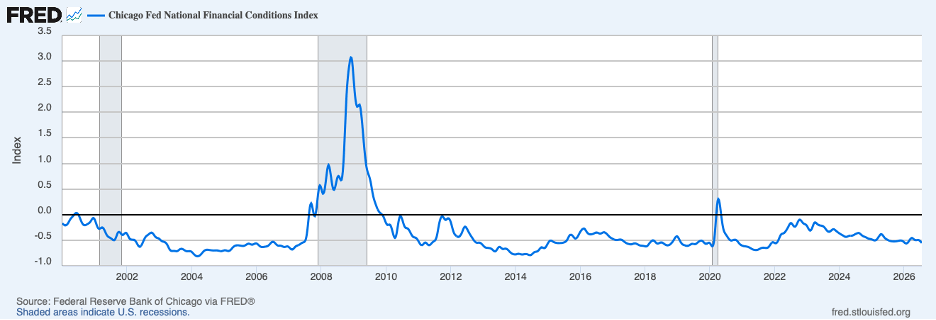
Interest rates are too low to restore price stability. Indeed, the Chicago Fed national financial conditions index, next chart, shows substantial stimulus coming from the financial sector (through July 17), even as interest rates have risen and equity prices have fallen. Moreover, the very low level of initial claims for unemployment insurance, shown next, implies that the economy is performing very well and may be on the verge of overheating.
For the good of the economy over the longer haul, especially the labor market, monetary restraint is needed now.
Header image: Daniel Jerez / Unsplash


