
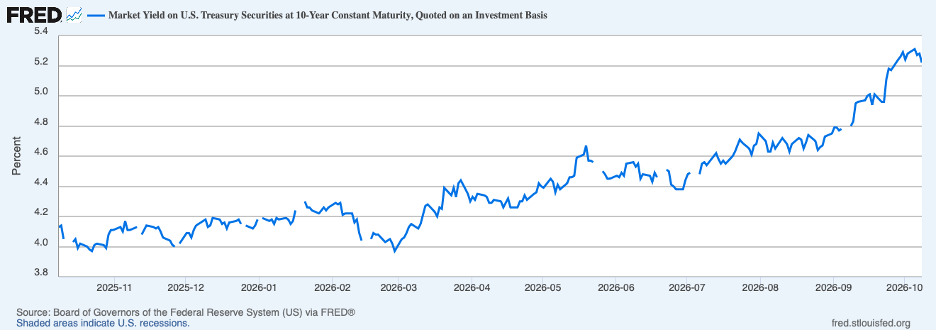
A lot of attention has been given lately to the big increase in interest rates since the summer. The chart below shows that the yield on the benchmark ten-year Treasury note has risen around 85 basis points since mid-year and 125 basis points from its late-February low. Many are asking whether interest rates have peaked or perhaps overshot on the upside.
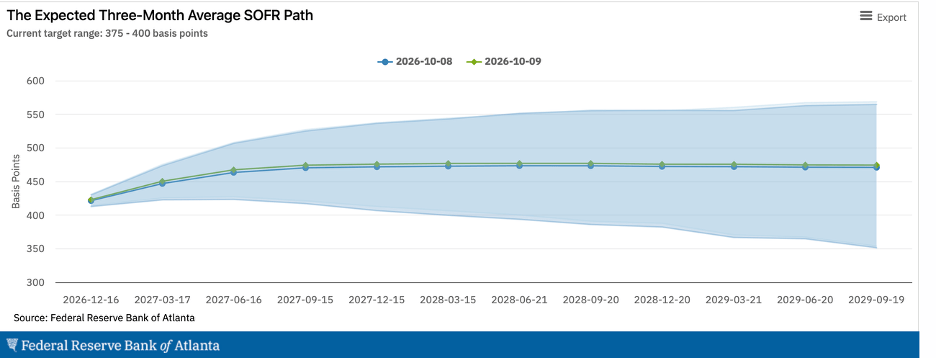
At the heart of this issue is how much higher must the Fed raise the federal funds rate to get inflation under control. Currently, market participants are expecting that the Fed will raise the target for the federal funds rate roughly 100 basis points over the next year and hold it there for a couple years, as shown in the next chart. These expectations are built into longer-term interest rates, such as the yield on the ten-year note.
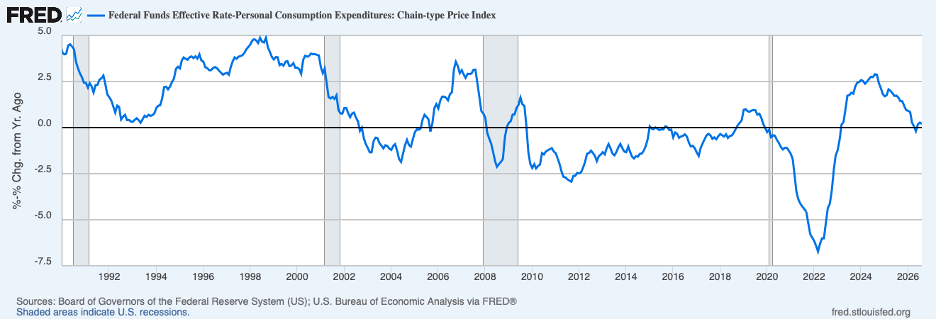
Will such a trajectory for the federal funds rate do the job? To get a handle on this question, it is useful to start with the current reading on the real federal funds rate. The next chart shows the real federal funds rate. The estimate for September, 0.9 percent, is shown by the red dot. This level of the real federal funds rate is below the neutral (or natural) rate, implying that monetary policy currently is boosting growth in aggregate demand and placing inflationary strains on resources.
The neutral rate is not observed directly and must be estimated. The next chart shows a commonly followed model estimate of the neutral rate (R-star, the blue line), which currently is around 1.7 percent or about 80 basis points above the current real federal funds rate.
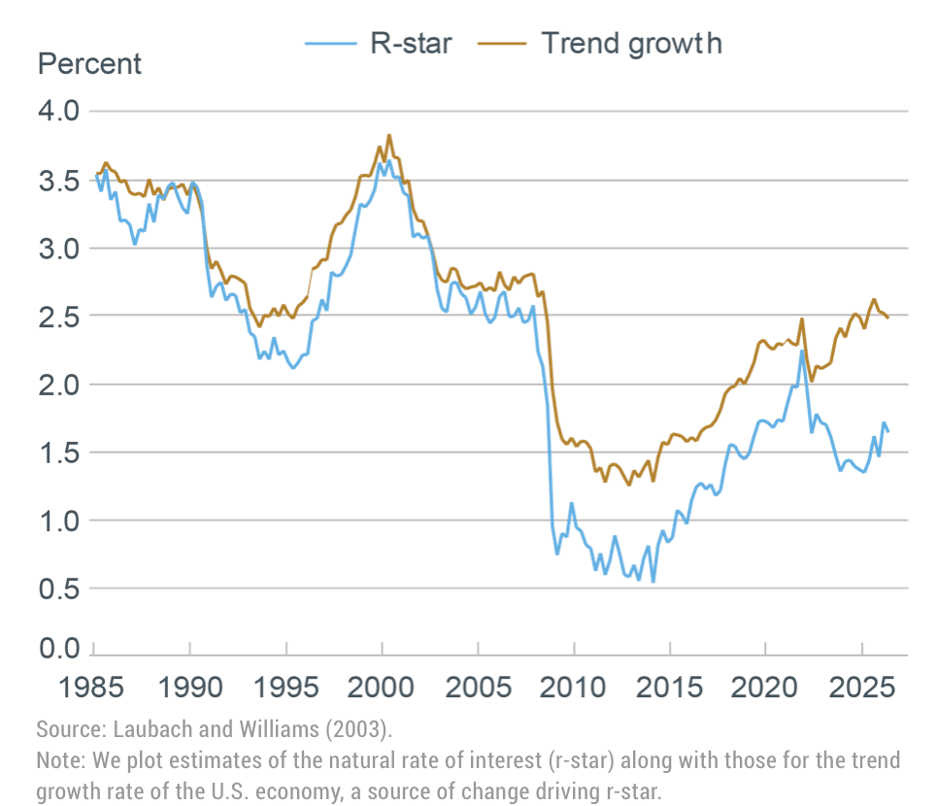
Moreover, there are good reasons to believe that a 1.7 percent neutral rate may be too low. The chart shows an estimate of trend growth of 2-1/2 percent, and there are sound economic reasons why we should expect the neutral rate to be near trend growth. Furthermore, during the decade leading up to the financial crisis, the neutral rate is estimated to have been between 2-1/2 and 3-1/2 percent. This is relevant for comparison because that period, like the current one characterized by an AI shock, was characterized by a productivity shock associated with the Internet and other IT adoptions. Taking the lower end of this range — 2-1/2 percent — means that the federal funds rate must increase another 1-1/2 percent before stimulus coming from monetary policy is removed.
The most recent CPI data for September confirm that Fed policy remains accommodative and the current level of the federal funds rate is appreciably below neutral. The headline CPI increased 3.7 percent over the twelve months ending in September (the solid blue line in the chart below), up from 3.4 percent in August and 3.0 percent a year earlier. Much of the acceleration in prices was due to a jump in fuel prices that month.
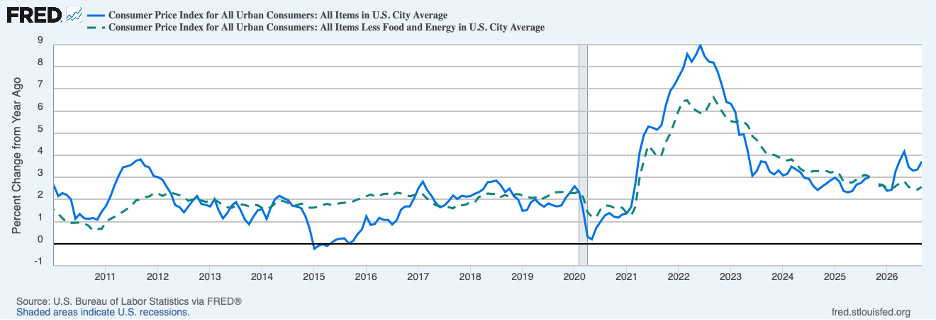
The core measure of consumer price inflation (the dashed green line), which excludes food and energy prices, rose 3.2 percent over the twelve months ending in September, up from 3.0 percent in August.
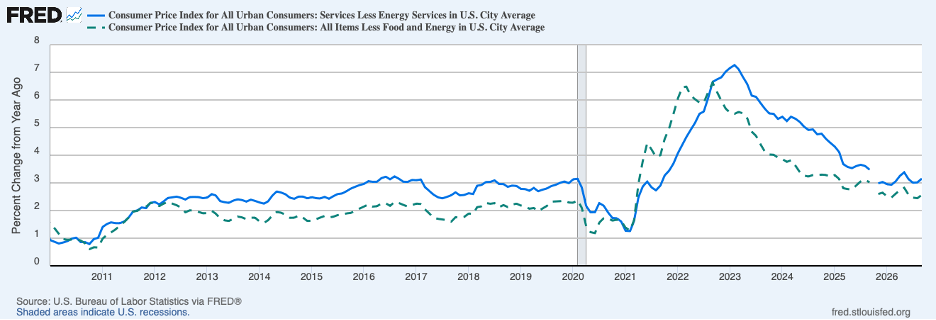
Fluctuations in tariffs and supply chain disruptions have impacted prices of nonenergy commodities in core inflation. In these circumstances, prices on nonenergy services may be giving a better reading on underlying inflation trends. The solid blue line above shows service price inflation along with core price inflation, the broken green line. Service-price inflation was 3.1 percent in September, up slightly from 3.0 percent in August. Moreover, service-price inflation over the six months ending in August picked up to 3.5 percent at an annual rate from 2.7 percent over the previous six months. Not only are CPI data pointing to considerable stimulus coming from the Fed, but early estimates of output growth in the third quarter are on the order of 3 percent or higher — notably above growth in the capacity of the economy to grow.
Only removing the stimulus coming from monetary policy, however, will not be sufficient to bring inflation lower. The real federal funds rate will need to move above neutral for a time — likely 50 basis points or more — to impose restraint on inflation. This reasoning implies that the federal funds rate will need to increase another 200 basis points, 100 basis points more than currently expected by market participants. Once the monetary restraint takes hold and places inflation on a clear downward trajectory, the Fed will be able to begin lowering the nominal federal funds rate. Indeed, to lessen the degree of monetary restraint, the Fed will need to lower the nominal federal funds rate by more than the decline in inflation, thereby placing the real federal funds rate on a downward path to neutral.
Real long-term interest rates have also increased a good bit lately, and the increase has accounted for the bulk of the increase in nominal long-term rates. The chart below shows that the yield on the thirty-year Treasury inflation-protected bond has risen to 3.3 percent. This rate has risen in response to prospective Fed tightening, strong credit demands to finance massive AI-related investments, and growing federal government borrowing over coming decades.
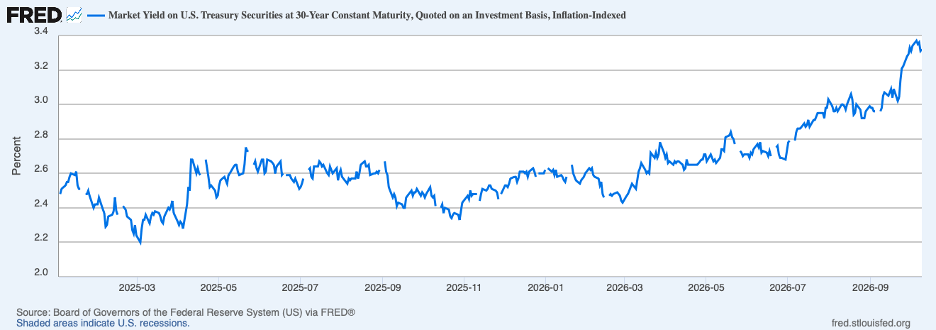
The average expected federal funds rate over the next thirty years can be derived from this yield by subtracting a term premium of around 1 percent that investors require as compensation for the price risk of holding a long-term bond. These numbers imply that the average real federal funds rate expected over the next thirty years is around 2 percent. This estimate would seem to be on the low side judging from the level of the real neutral rate over long periods of history.
To sum up, long-term interest rates have further to rise, in part because the Fed’s task of bringing inflation down will require even larger increases in the federal funds rate than now expected by market participants. The Fed cannot count on the recent increase in long-term rates to do the job. The Fed needs to get out front and aggressively tighten policy.
Header Image: Connor Gan / Unsplash


