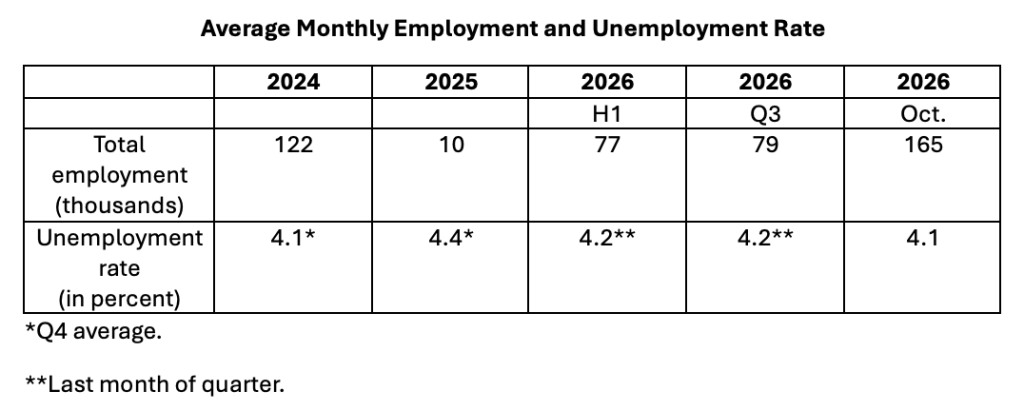
The fourth quarter has started out with a bang, judging from the employment report for October. The table below shows that employment rose by 165,000 last month, double the average pace over the first nine months of the year, and the unemployment rate fell to 4.1 percent. Employment gains in 2026 have greatly outpaced those in 2025.
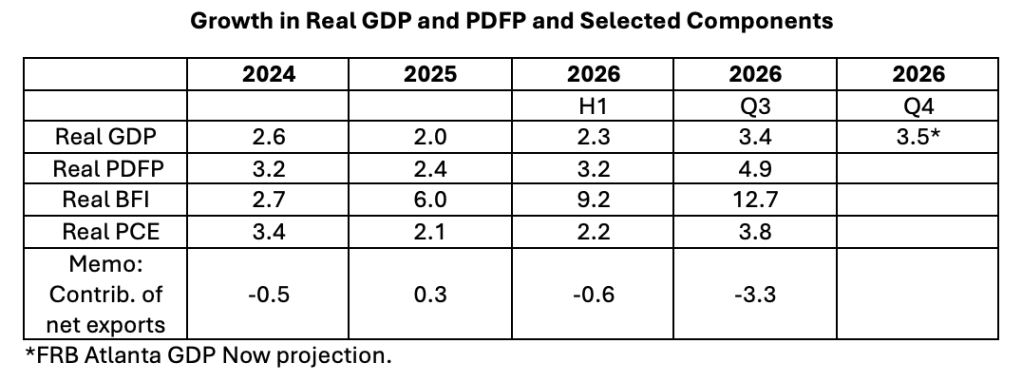
The first line in the next table shows that growth in real GDP has strengthened in the second half of this year. This pickup has been accompanied by faster growth in demand by domestic purchasers — private domestic final purchases (PDFP), the second line. Especially notable has been the contribution of a surge in business fixed investment (the third line) driven primarily by investment in AI, including the buildout of data centers. Over the past year, business outlays on data centers nearly doubled, from $51 billion to $97 billion (September 2025 to September 2026), and outlays on computers and peripheral equipment have surged from $296 billion to $504 billion (Q3 2025 to Q3 2026).
Growth in private demand (PDFP) has exceeded that of domestic output consistently over recent years. The 4.9 percent pace of growth in PDFP in Q3 surpassed that of GDP by 1.5 percentage points. Such strong growth in demand would be placing even more pressure on domestic resources if some of this demand were not directed to foreign producers. The last line in the table shows the contribution of net exports (exports less imports) to growth in real GDP; diversion of domestic demand to imports has held down growth in GDP this year. This contribution of the external sector to moderating growth in domestic production was especially consequential in the third quarter when net exports trimmed 3.3 percentage points off growth in real GDP, thereby relieving some demand pressures on domestic resources and inflation.
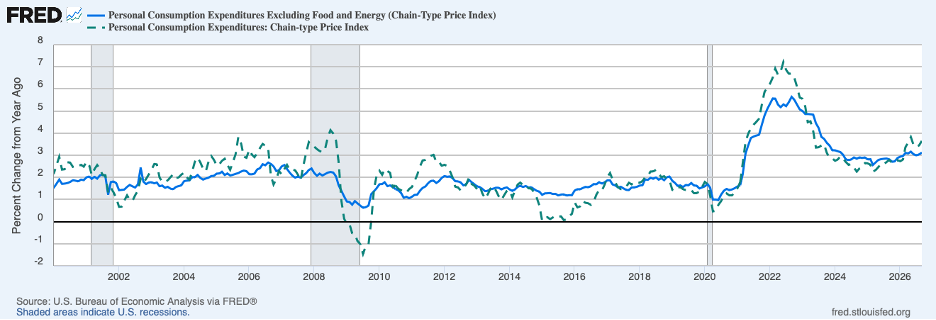
Nonetheless, inflation momentum continued through September. The chart below shows that twelve-month headline PCE inflation (the broken green line) rose to 3.6 percent, up from 3.4 percent in August and 2.3 percent a year earlier. Similarly, core inflation picked up to 3.1 percent from 3.0 percent in August and 2.8 percent a year earlier.
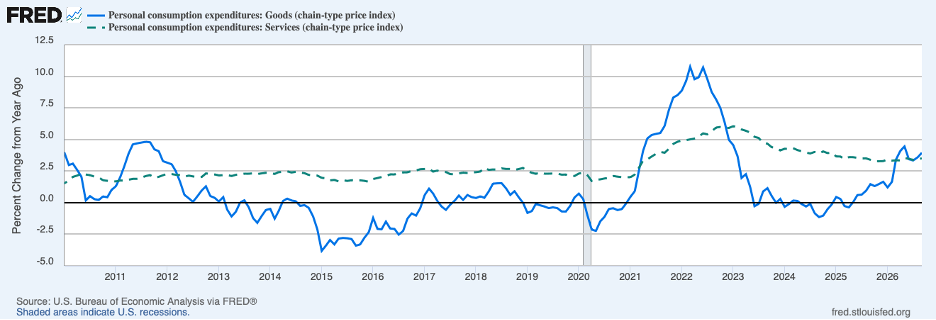
The next chart shows that goods-price inflation (the solid blue line) has swung widely over recent years, attributable mostly to tariffs and oil prices. In these circumstances, service prices (the broken green line) are a better indicator of underlying inflation. Service prices rose 3.5 percent over the twelve months ending in September — 1.25 percentage points above the average during the decade preceding the pandemic — and have shown few signs of slowing over the past year; the increase in service prices over the six months ending in September was 3.4 percent at an annual rate, not significantly different from the 3.5 percent annual rate over the previous six months.
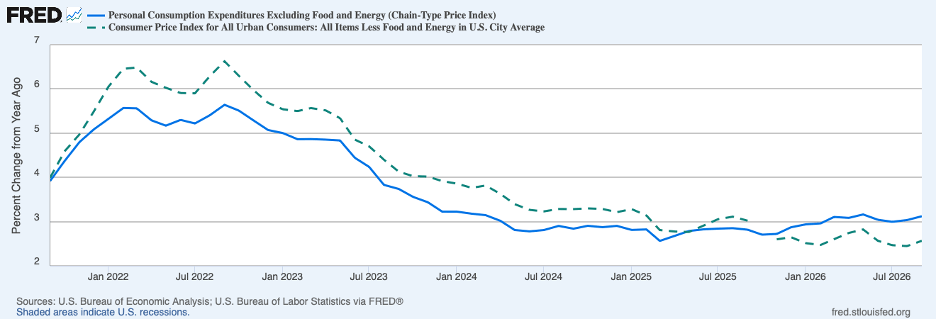
(The just-released CPI data for October also suggest that underlying inflation is not showing signs of moderation through last month.)
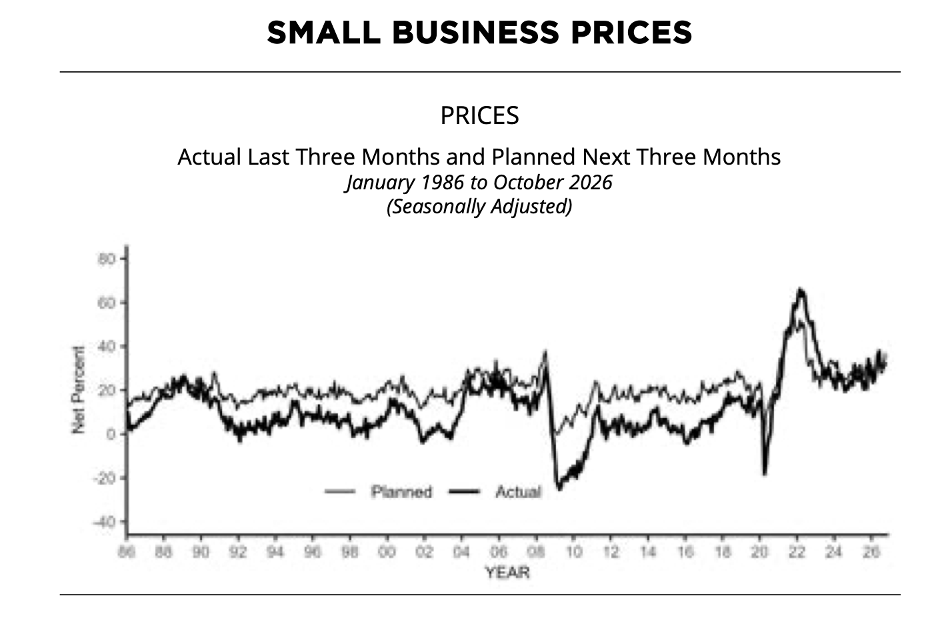
Looking ahead, a growing share of small businesses surveyed by the National Federation of Independent Business (NFIB) have been reporting plans to raise prices over coming months. The upturn is shown by the gray line in the chart below.
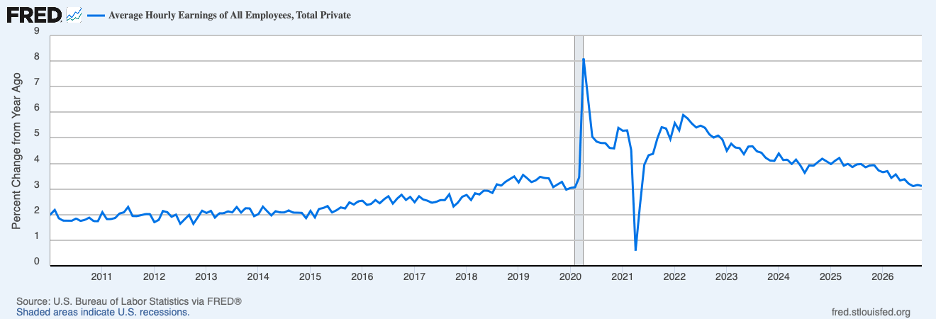
Some observers have pointed to decelerating wages as an indicator of reduced cost pressures on businesses and a portent of prospective disinflation. The next chart shows the twelve-month change in average hourly earnings from the monthly employment report. The chart shows a steady slowing of increases in average hourly earnings for more than a year.
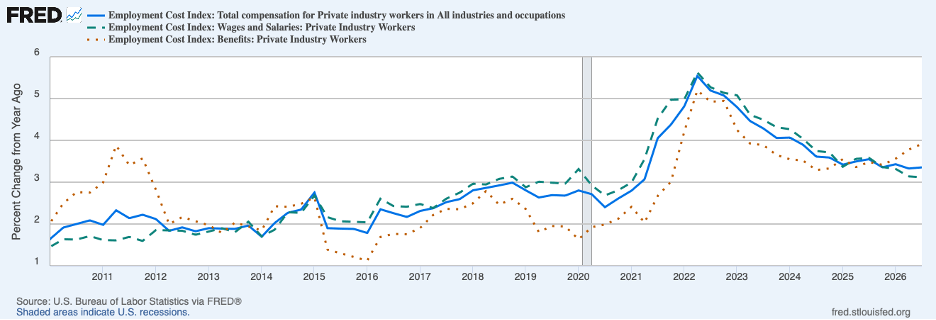
However, the following chart, illustrating increases in overall compensation, shows steady increases in overall labor costs (the solid blue line) over the same period. A slowing in growth of wages and salaries (the broken green line) has been offset by faster increases in benefits (the dotted red line) largely owing to increased contributions to health care plans. Thus, despite slowing wage growth, businesses continue to face steady labor cost pressures.
The above evidence indicates that the Fed’s monetary policy is fostering momentum in output growth and in inflation. With inflation running well above the Fed’s 2 percent target, no relief in sight, and a robust jobs market, the Fed has little choice but to continue raising the federal funds rate. The next chart shows that the market is expecting the Fed to raise the federal funds rate from its current range of 3.75%–4.00% to 4.25%–4.50%.
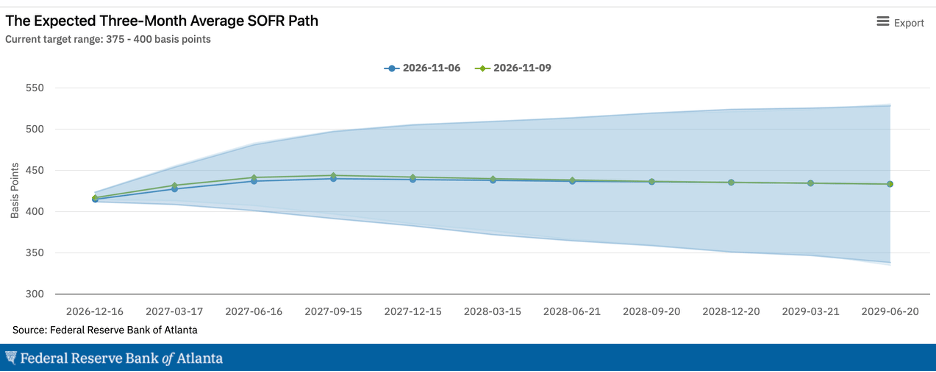
Such an increase is not likely to be sufficient, meaning that both short-term and long-term interest rates need to move higher to place underlying inflation on a downward path to the 2 percent target. Pausing will only delay the achievement of price stability.
Header Photo: Federal Reserve Board of Governors / Wikimedia Commons


