
Much has been said about the slowdown in the economy in the final months of 2020 and the beginning of 2021. Employment gains averaged only 30 thousand per month over the months of November to January, compared to nearly 1 million per month over the previous three months. In contrast, growth in industrial production—mostly tangible goods—averaged 1 percent per month over the November-to-January period (12 percent at an annual rate), up from 0.7 percent over the previous three months.
What can account for this apparent anomaly of faster growth in industrial output than in the number of workers employed? First, industrial production measures the output of tangible products, with the exception of energy services. As mentioned in previous commentaries, service sectors, such as hotels, air travel, entertainment, and restaurants and bars, have been held down most by social distancing and government restrictions (see December 12, 2020, The Demise of This Expansion is Greatly Exaggerated). Second, worker productivity—output per hour—took a hit when output growth slowed toward the end of last year, and this meant that growth in workers employed was not being translated into gains in output as it had previously. And third, employers were responding to the greater demand they faced by having their current employees work more hours instead of hiring new employees (see January 20, 2021, More Stimulus Justified? A Contrarian View and February 13, 2021, The Economy: Spring is Just Around the Corner).
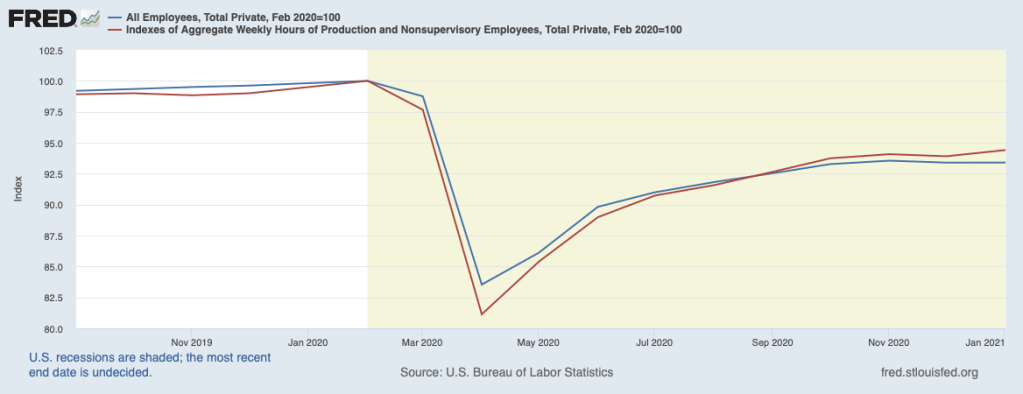
The chart below shows an index of the number of employees who are working (the blue line) and an index of hours worked (the number of employees working multiplied by the average number of hours worked, the red line). Both are normalized to equal 100 in February of 2020, just prior to the nationwide shutdown. At the onset of the pandemic in March and April, hours worked declined more sharply than the number of employees as employers cut back on hours worked per employee as a means of holding onto some employees. By summer, both workers hired (or brought back from layoff) and average hours worked were recovering and the two lines moved toward convergence. In recent months, employers have confronted rising demand by relying more on increasing average hours worked per employee than on hiring additional employees, causing the red line to rise above the blue line (see February 13, 2021, The Economy: Spring is Just Around the Corner). As employers become more confident that strengthening demand will persist, they will step up hiring of new employees and will cut back on average hours worked.
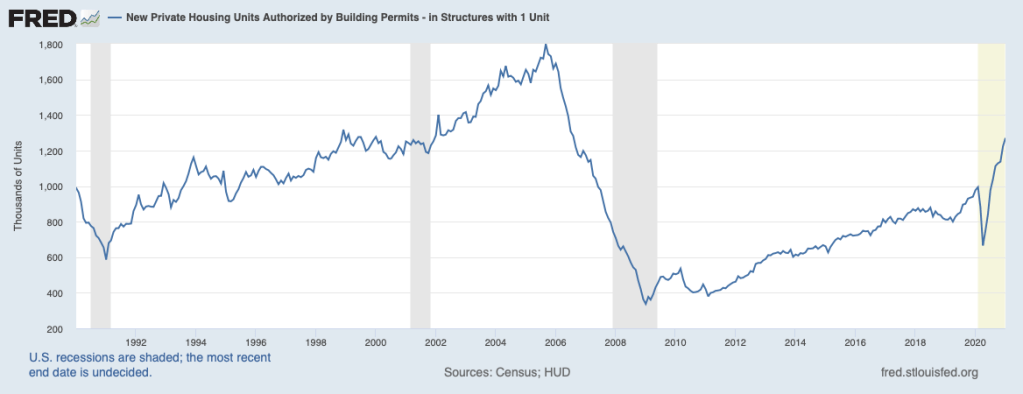
The burst in consumer spending in January suggests that aggregate demand is getting a big lift from the household sector. Personal consumption expenditures rose 2 percent that month (25 percent at an annual rate). While consumers will not continue to boost spending at that rate, fundamentals in the household sector overall point to solid gains in coming months (strong wealth positions and an exceptionally high saving rate, see December 12, 2020, The Demise of This Expansion is Greatly Exaggerated). Households also are jumping into the housing market in a way not seen since the buildup of the housing bubble of a decade-and-a half ago, as illustrated by chart below showing single-family permits. This robust demand for housing also is causing a big run-up in home prices to a double-digit pace, echoing the bubble period.
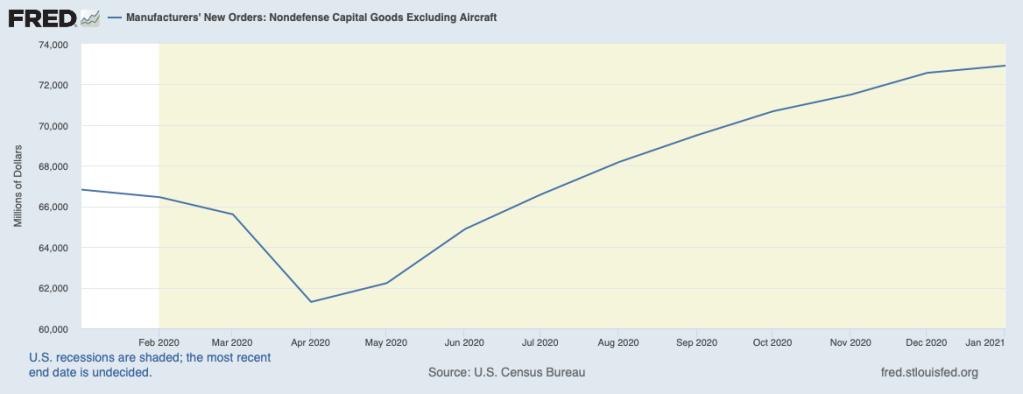
Moreover, businesses are getting into the action, as well. The next chart shows new orders for capital goods. In January, orders had risen to a level 10 percent above the pre-pandemic period. Growing order backlogs are prompting capital goods producers to step up production schedules, adding to upward momentum.
Not all sectors of the economy, though, are participating in the upward momentum. Notably, those most affected by social distancing—airlines, entertainment, hotels, and hospitality—have been seriously lagging the rest of the economy. As the COVID threat recedes, many of these will see their fortunes revive and will start to catch up. Once this recovery begins, many of these lagging businesses in the service sector will experience faster growth.
However, not all businesses in the lagging sectors will survive in the post-COVID world, and the labor and other resources that these businesses have commanded will need to transition to more vibrant sectors. Public policy has been providing benefits to business owners and their employees to stand in place, thereby discouraging those who will not be utilized in the post-COVID world from moving to where they will find viable opportunities for employment in the future.
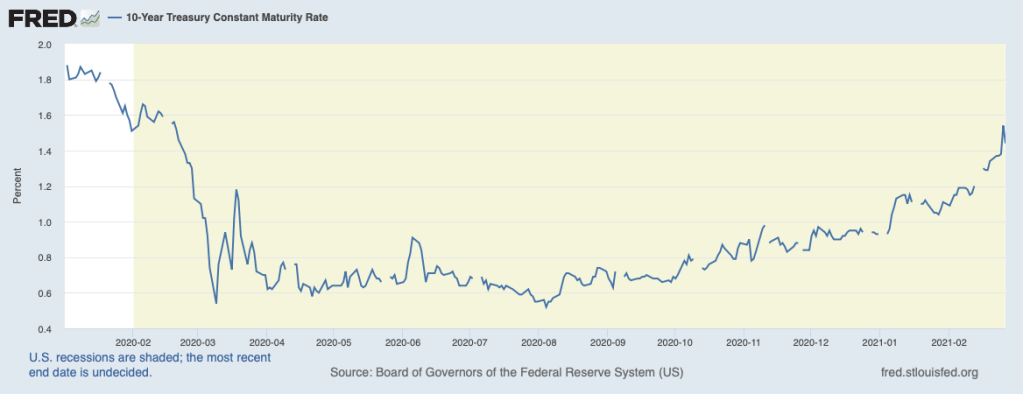
One of the concerns that has been raised about the sustainability of the recovery has been prompted by the backup in interest rates over recent weeks, as illustrated by the benchmark 10-year Treasury yield in the chart below. To many observers, higher rates appear to be an obstacle to further expansion in the economy. However, this climb in rates is a reflection of mounting evidence that the recent strengthening in economic activity will persist, enhanced by prospects for enactment of the massive fiscal package. These same forces have also contributed to the recent jump in gasoline prices. That is, higher interest rates and gas prices reflect the growing recognition that the economy has sufficient forward momentum and can withstand the restraint coming from higher rates and gas prices.
The bottom line is that the economy has entered a new phase of robust expansion. The Fed’s super-accommodative monetary policy is adding to the momentum, and more fiscal stimulus is not required. Any further stimulus will add to the already heavy burden that has been pushed onto our children, grandchildren, and great grandchildren (see January 20, 2021, More Stimulus Justified? A Contrarian View).
For more on the recuperative forces underlying market-based economies, see Chapter 2 of my book—Capitalism Versus Socialism: What Does the Bible Have to Say?
