
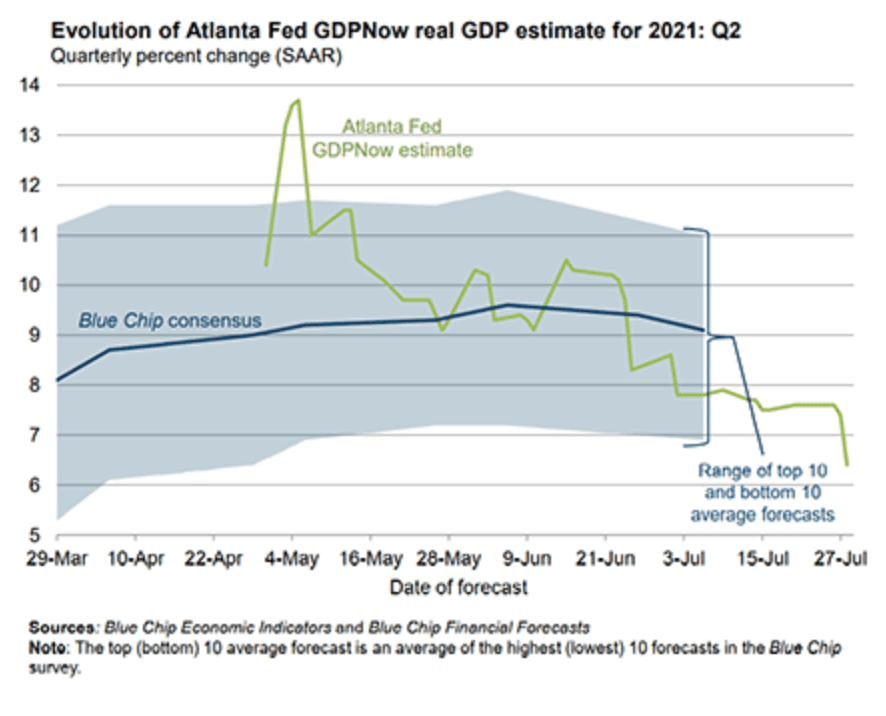
The second quarter turned out to be something of a disappointment. Output was expected to grow at nearly a double-digit pace over much of the quarter, but came in at a 6-1/2 percent rate—little different from the first quarter. This is illustrated in the chart below produced by the staff of the Federal Reserve Bank of Atlanta. The chart shows estimates of growth in real GDP over the course of the second quarter made by the staff of the Atlanta Fed (using a statistical model, green line) and a group of professional forecasters (Blue Chip, the blue line). The Atlanta Fed estimate at one point was as high as 13-1/2 percent and the Blue Chip as high as 9-1/2 percent, but both dropped a considerable amount toward the end of the quarter to about the 6-1/2 percent are—where the actual number came in. The good news is that the level of real GDP finally surpassed the peak in the fourth quarter of 2019, before the onset of the pandemic. The unemployment rate, though, was 5.9 percent—2.4 percentage points above its pre-COVID level—and total hours worked were 4.5 percent below the peak level.
During the quarter, growth in aggregate demand exceeded growth in supply by a good margin. Pacing growth in aggregate demand was spending on consumer goods and on consumer services—each of which rose at a nearly 12 percent annual rate. Sellers responded by drawing down inventories further and by raising prices.
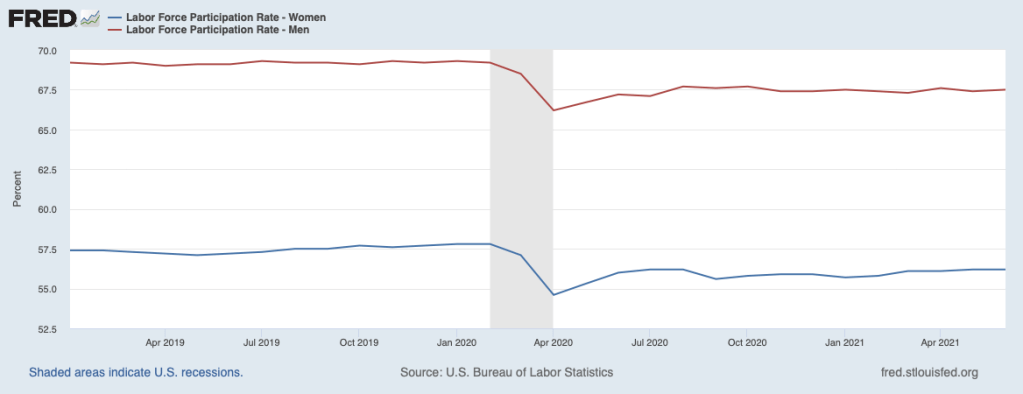
Restraints on supply limited growth in output last quarter. Many of those restraints have come from supply chain disruptions, especially chip shortages. Also, many businesses, notably in the more hard-hit areas of the service sector, have had difficulty drawing workers back to the job. The next chart shows the labor force participation rate for women (blue line) and men (red line). Participation rates for both dropped off markedly at the onset of COVID. Since then, they have recovered only partially, being flat over recent months (the similar pattern for men and women runs counter to the notion that a disproportionate number of women left the labor force during the pandemic to care for children unable to return to daycare or the classroom). It is worth noting that individuals who deem themselves not to be in the labor force are not counted as unemployed; these individuals get counted as being unemployed when they return to the labor force and seek employment or as employed when they take a job.
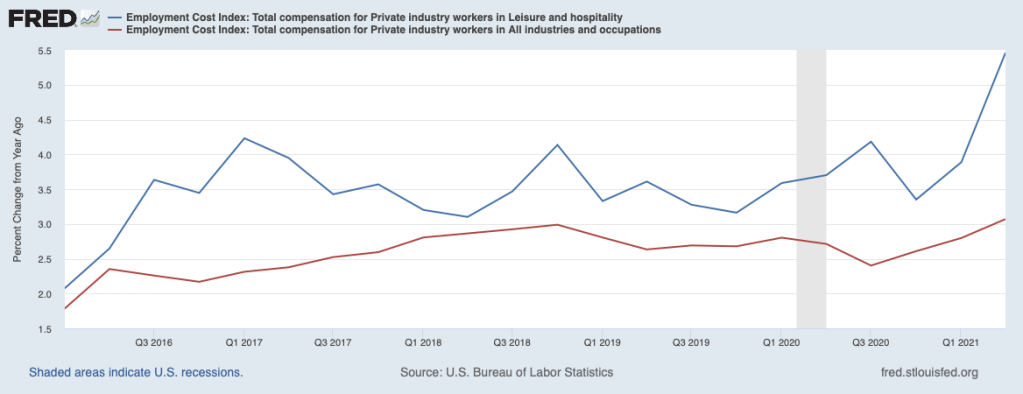
Employers have been posting a record level of vacancies and have been boosting compensation to fill those positions. The chart below shows twelve-month growth in total compensation (wages or salaries and benefits) for all workers in private industry (red line) and for workers in the hospitality sector (primarily restaurants and bars and hotels, blue line). Growth in compensation has crept above the pre-pandemic pace for all private-sector employees, but has surged in the hospitality sector where labor shortages have been most acute. To date, higher wages have been only partially successful in getting people back on the job.
Restrictions on supply in the face of brisk demand are boosting prices, especially in certain categories as illustrated in the table below (drawing from the Consumer Price Index for June). The table shows changes in the prices of all consumer goods and services and selected categories—for the month of June, over the second quarter of this year, and from the eve of the pandemic in February of 2020 to June. Prices for all categories rose 0.9 percent in June and 2.3 over the three-month period ending in June. The three-month change is nearly half of the 5 percent increase since the onset of the COVID shock. This pattern underscores the pickup in inflation that has occurred over recent months.
Selected Categories of Consumer Prices (percent change)
| Category | June ‘21 | Q2 ’21 | Feb. ’20 to June ‘21 |
| All items | 0.9 | 2.3 | 5.0 |
| Energy | 1.5 | 1.4 | 20.6 |
| Commodities* | 2.2 | 6.0 | 7.3 |
| Appliances | 0.1 | 0.1 | 9.0 |
| New cars & trucks | 2.0 | 4.1 | 2.0 |
| Used cars & trucks | 10.5 | 27.8 | 44.0 |
| TVs | 1.3 | 5.3 | 4.3 |
| Computers | 0.1 | 5.8 | -2.6 |
| Apparel | 0.7 | 2.2 | -2.4 |
| Medical care | -0.1 | -0.1 | 1.0 |
| Airfares | 2.7 | 19.9 | -5.5 |
| Food away from home | 0.7 | 1.6 | 5.3 |
| Lodging (hotels) | 7.9 | 15.0 | 0.7 |
| Car & truck rental | 5.2 | 33.5 | 79.2 |
*Commodities excluding food and energy.
Prices of commodities, also shown, typically rise less rapidly than other (service) prices over time, but recently have turned up appreciably. Increases have been especially large for the prices of new cars and trucks, TVs, and computers, where chip shortages and other supply chain disruptions have been most pronounced in limiting the ability of sellers to meet strong demand. Airlines and lodging were particularly hard hit by the pandemic, along with restaurants, but their prices have picked up sharply in recent months as demand for travel has recovered smartly. Shortages of motor vehicles have had an especially large impact on the prices of used cars and trucks and on rental rates for cars and trucks. Note that prices for medical care, which commonly have outpaced other prices, registered only tepid increases since the onset of the pandemic.
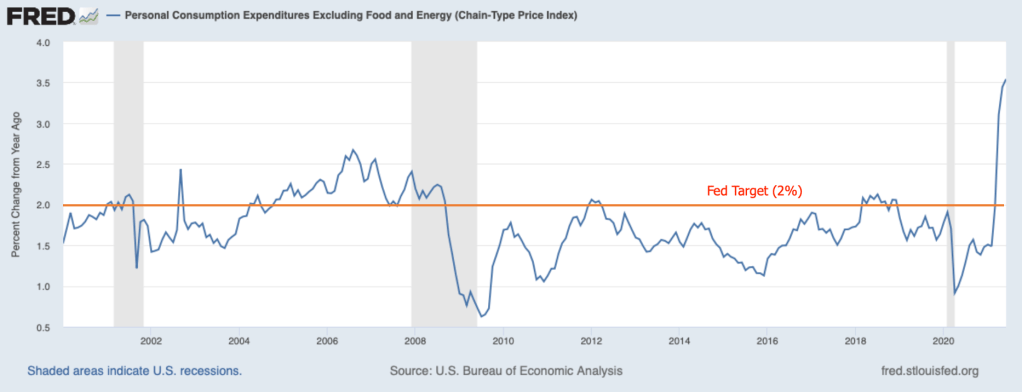
Looking ahead, supply restraints are likely to be easing only slowly in the coming months. As a consequence, the recovery in output will continue to be curbed and outsized price increases for commodities and some services will persist. The next chart illustrates the recent behavior of an index of prices that the Federal Reserve follows closely—the twelve-month change in the Personal Consumption Expenditures Index for all items excluding the volatile food and energy components. It jumped to 3.5 percent in June, well above the target of 2 percent set by the Fed. The Fed has said that it is seeking inflation to average 2 percent over time in order to stabilize inflation expectations around 2 percent. Accordingly, it has said that it is willing to tolerate prices rising moderately faster than 2 percent for a while to make up for shortfalls in recent years. The Fed has also opined that much of the pickup in inflation in recent months reflects transitory forces that will fade in the period ahead. Therefore, the Fed has argued that patience is called for at this time: The public should not panic and come to expect high inflation going forward.
Meanwhile, the Fed will continue its highly accommodative monetary policy of purchasing $120 billion per month (Treasury securities and agency mortgage-backed securities) and of holding the target for its policy interest rate (the federal funds rate) at the effective lower bound—0 to ¼ percent. The Fed has said that it will begin tapering its asset purchases once it has determined that “substantial progress has been made toward its maximum employment and price stability goals.” It has acknowledged that some progress has been made toward these goals and it will continue to monitor developments to determine whether further progress is being made. The presumption is that tapering of asset purchases will begin long before rate hikes.
The Fed has said that it will not begin to raise the target for the federal funds rate until labor market conditions are consistent with “maximum employment and inflation has reached 2 percent and is on a path to moderately exceed 2 percent for some time.” It seems that the second and third conditions have been met in recent months. Regarding the first condition, standard measures of labor market slack—the unemployment rate along with labor force participation—suggest that a lot more improvement is needed before the first condition is met. (The Fed as recently as June deemed an unemployment rate of around 4 percent to be consistent with maximum employment—nearly 2 percentage points below the current level.)
The state of the labor market would imply that the lift-off for the federal funds rate is a long way off. However, should the recent flare-up of inflation cause the public’s expectations of inflation to move above the 2 percent area, the Fed would face a dilemma. If inflation expectations were allowed to run above 2 percent, the job of returning actual inflation to the 2 percent target would be compounded. Delaying action to rein in inflation—and restoring inflation expectations to the 2 percent area— would risk further increases in inflation expectations and an erosion in the Fed’s credibility. However, raising the federal funds rate target ahead of clear evidence that the labor market has achieved maximum employment would also undermine the public’s confidence in the Fed. Let’s hope that inflation expectations remain anchored around 2 percent.

One thought on “The Economy: What Have We Learned from the Second Quarter?”