Restraints on the supply of goods and services continue to hold back economic expansion and boost inflation. Ongoing restraints on supply were confirmed by the employment report for September which showed overall job gains of only 194 thousand in contrast to expectations of 475 thousand. To be fair, private payroll increased 317 thousand in September and the figure for August was revised to 90 thousand. Public education workers at the state and local level account for the difference between overall and private sector employment growth. This impact is a reversal of what happened late in the spring and early in the summer when public education workers boosted overall employment. (In September, seasonal adjustment factors were anticipating more public education hires than actually occurred, as COVID-related disruptions continued to affect measures of employment in this sector of the economy). Nonetheless, hiring has slowed appreciably in recent months and private sector employment is off 5 million or 3.8 percent from where it would have been absent the pandemic.
Ordinarily, greater demand gets translated into more output and employment and very little change in inflation. However, this year, greater demand—fueled by massive fiscal stimulus and the ultra-low interest rates of the Fed—is having a more limited effect on output and employment but a more pronounced impact on inflation. This pattern has become evident since the spring of this year.
The recent outcome of lower growth and more inflation has come as a surprise to many observers and to the Fed. The surprise to the Fed can be seen in the projections of Fed policymakers for growth in output and inflation in 2021. As shown in the table, the median forecast of inflation for 2021 has risen steadily from 2 percent in March of this year to 4.2 percent most recently while that for growth in output has been lowered from the 6-1/2 to 7 percent area earlier in the year to 5.9 percent most recently.
| 2021 | Growth in real GDP | Inflation |
| March | 6.5 | 2.0 |
| June | 7.0 | 3.4 |
| September | 5.9 | 4.2 |
It is noteworthy that implicit in this forecast is a slowing of inflation from a 5.4 percent annual rate from the end of last year to August to only a 0.6 percent rate over the remainder of the year—not very plausible given inflation pressures in the pipeline. Also, these projections imply that growth in real GDP will step down to a 3-1/4 percent rate over the second half of this year from a 6-1/4 percent pace in the first half. Based on currently available data, growth in output is likely to be a good bit lower over the second half than implied by the Fed’s forecast.
Supply restraints will continue to restrain production and thus keep pressures on prices in the months ahead. Some of those pressures are coming from a pronounced reluctance of workers to take the record number of jobs that employers are posting. The chart below shows the number of people continuing to collect unemployment insurance.

The number collecting unemployment insurance has declined only slightly over recent months, even as the $300 per week supplemental unemployment insurance benefit (amounting to $7.50 per hour for a forty-hour week) was being removed. The number collecting unemployment insurance remains more than one million above the pre-COVID level and accounts for roughly half of the higher number of unemployed workers since February 2020.
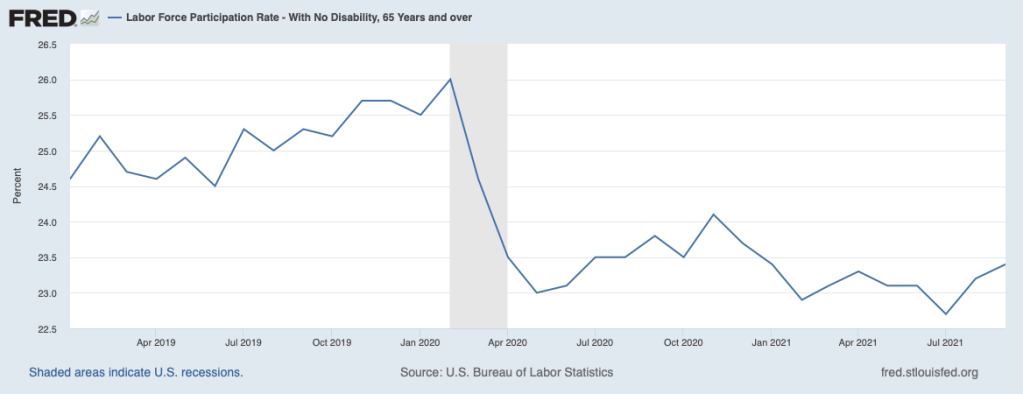
The reluctance of people to take the record number of available jobs is also very evident among those who are not in the labor force—those who are not employed and who do not identify themselves as seeking a job (that is, as being unemployed). This is shown in the top chart below that plots the labor force participation rate for those in the prime working-age group and those of retirement age, the following chart.
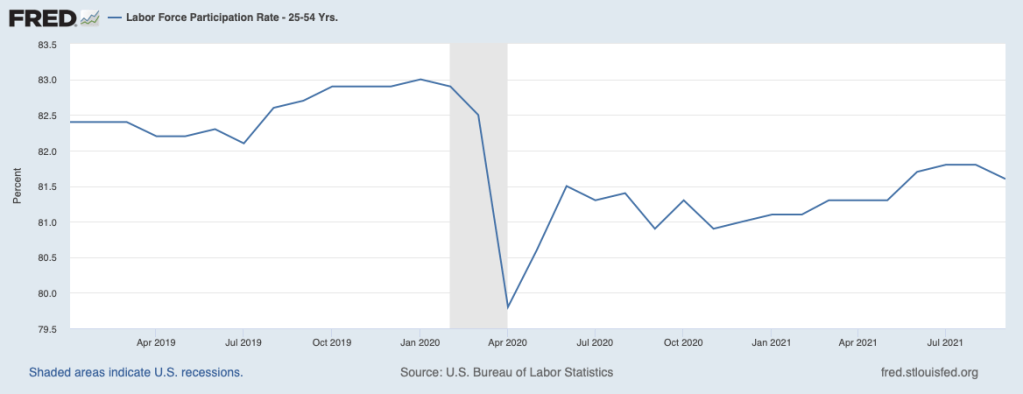
Participation of both groups dropped off markedly at the onset of the pandemic in 2020. The participation rate for those in the prime age group recovered somewhat by the early summer of last year but has not recovered much since. Participation on the part of those in the retirement-age group also dropped off markedly at the onset of COVID but has not shown much change since that time.
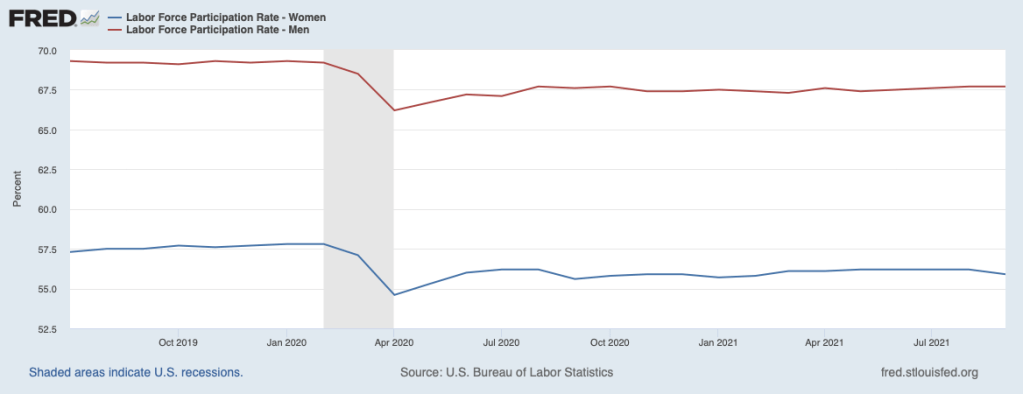
The next chart, showing participation rates of women (blue line) and men (red line), shows very little difference in the behavior of their respective participation rates.
Employers are responding to this difficulty in hiring workers by upping compensation. Average hourly earnings in the private sector have increased 5-1/2 percent over the past twelve months, up from 3-1/4 percent before the pandemic. In the leisure and hospitality sector, where difficulties in attracting workers have been most acute, average hourly earnings have jumped from a twelve-month change of 4-1/2 percent to 12-3/4 percent most recently. Going forward, opposition to the growing number of vaccination mandates may be adding to the reluctance on the part of many workers to take available jobs. Ongoing wage pressures will continue to be reflected in the prices that we will be paying for goods and services.
In addition to this reluctance to take plentiful jobs, supply chain disruptions are also curbing the supply of goods and services. Reports abound about pervasive constraints posed by the microchip shortage. This shortage has hit the motor vehicle sector especially hard where sales dropped to only at a 12-1/4 million annual pace in September, about 4 million units below normal. Furthermore, employment in motor vehicles actually declined in September as manufacturers held back on hiring in the face of shortages of key parts. The growing backlog of orders for new cars and trucks confirms the rising degree of unmet demand. Chip-related problems remain elevated elsewhere, too, such as for home appliances. Moreover, transportation bottlenecks, especially in trucking and ships, are adding to constraints on supply.
Mounting inflation pressures are shown in the next chart, containing the Fed’s preferred measure of inflation. The blue line shows the headline measure, which reached 4.3 percent for the twelve months ending in August. The red line excludes volatile food and energy prices and reached 3.6 percent over the same period. With supply restraints not about to ease in the months ahead and demand being very strong, we cannot expect much improvement on the inflation front for a while. Some look to the onset of the so-called fiscal cliff that will occur if no new fiscal stimulus measures are enacted as a looming force that will restrain demand and bring inflation down before it becomes a bigger problem. The impact of the prospective fiscal cliff is shown in the next chart. The red line is showing that the impact of the various COVID-related fiscal actions since March 2020 is fading and will slow growth in output in the coming year.

However, this forecast does not incorporate either of the so-called infrastructure bills currently before Congress. Moreover, this measure does not capture the massive amount of monetary stimulus in the pipeline and the vast improvement in consumer wealth positions that will continue to propel aggregate demand. As a consequence, growth in aggregate demand is unlikely to slow by much.

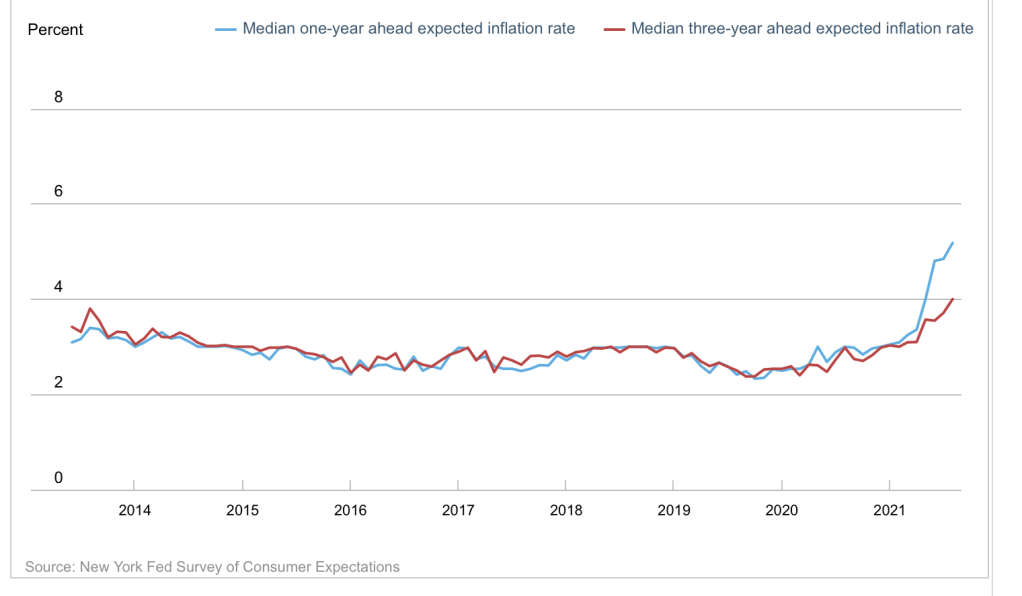
The public’s concerns about the inflation outlook have been surging in public opinion polls, and recent surveys of inflation expectations have been moving noticeably higher. The chart below shows results from a survey of consumers taken by the Federal Reserve Bank of New York. Expectations of year-ahead inflation are shown by the blue line while longer-term (three-year-ahead) expectations are shown by the red line. The latter has recently risen above the range that has characterized the history of this data series and suggests that longer-term consumer inflation expectations have moved above the Fed’s 2 percent target for inflation. In these circumstances, the Fed may well have fallen behind the curve which will require a pronounced swing in policy from its current highly accommodative stance. If the Fed takes away the punch bowl in this manner, the party will come to a sudden end.