
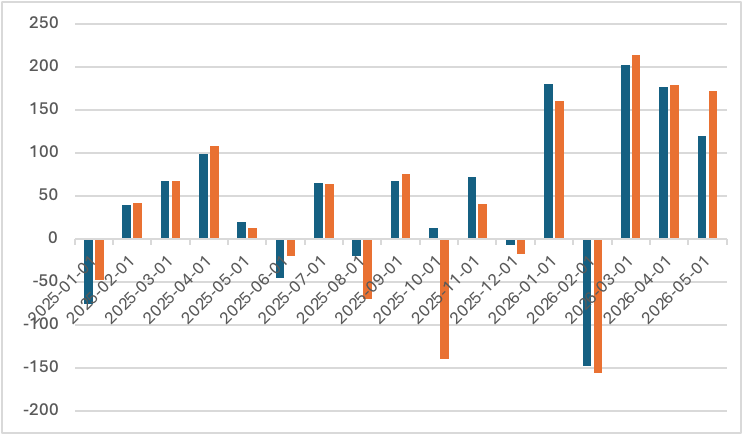
Job gains in the May employment report surpassed expectations while the inflation news in the May CPI report continued to be disappointing. The chart below shows that total nonfarm employment rose 172 thousand last month, continuing a string of three months of strong employment gains (averaging 188 thousand per month). Growth in private employment also continued to be brisk in May at 120 thousand (and 171 thousand average monthly gains over the past three months).
Change in Total and Private Employment
(In thousands)
Interpretation of monthly employment data has been complicated by the trimming of federal payrolls and the crackdown on immigration. These forces have contributed to a great deal of uncertainty regarding the so-called break-even level of employment increase (the level that absorbs new entrants to the labor force and keeps the unemployment rate unchanged). The break-even rate is estimated to have been as high as 100 thousand per month in the period prior to the COVID pandemic, to have risen sharply during the immigration surge from 2021 into 2024, and to have dropped markedly subsequently. Staff at the Federal Reserve Board estimate that the break-even rate in 2026 may be only slightly above zero; if this analysis is correct, then recent increases in employment should have been accompanied by declines in the unemployment rate (Murray, Seth and Ivan Vidangos, Labor Force Growth, Breakeven Employment, and Potential GDP Growth, FEDS Notes, April 2, 2026).
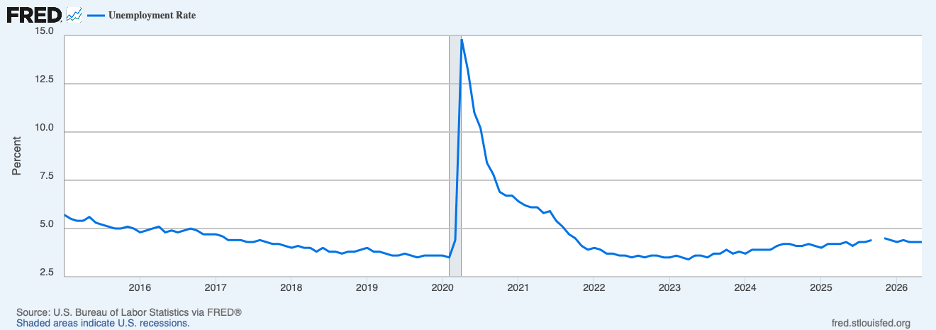
However, the unemployment rate, based on a different survey, has been little changed over the past year, as shown in the next chart. The unemployment rate in May stayed at 4.3 percent, close to estimates of the rate that is consistent with maximum employment (and steady inflation).
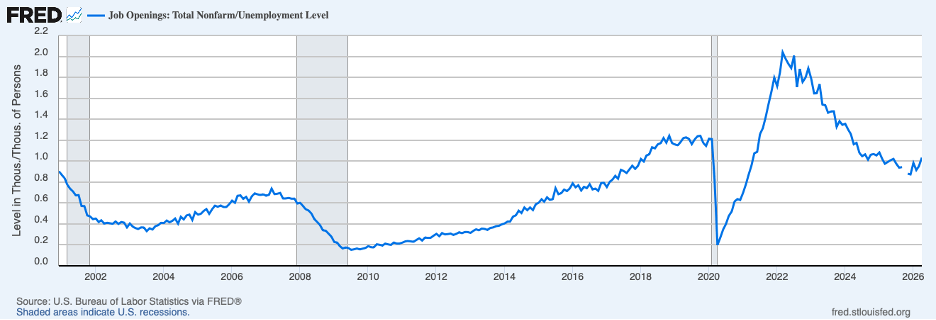
Other evidence on the labor market is in step with the unemployment rate and points to a labor market that has been relatively stable over the past year and functioning well. The next chart shows the ratio of job openings to the number of unemployed through April (most recent data). This ratio has been in the vicinity of 1.0 for the past year or so or one job for each person unemployed which has in the past been associated with a solid jobs market.
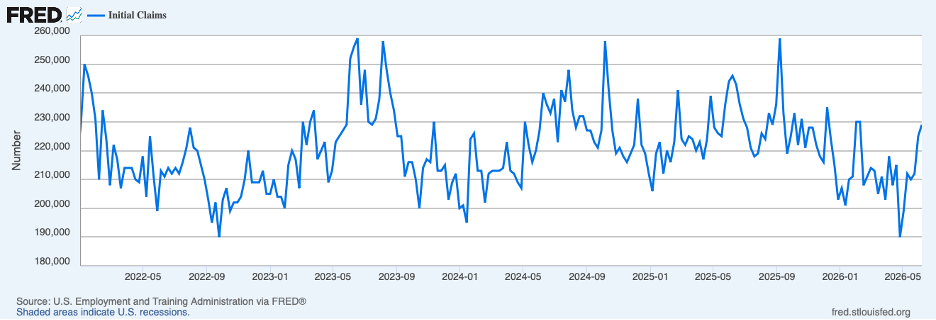
Similarly, new claims for unemployment insurance, shown next, though they have ticked higher over recent weeks, remain low and near levels of a year ago. Overall, recent news suggests that the labor market remains on a solid footing.
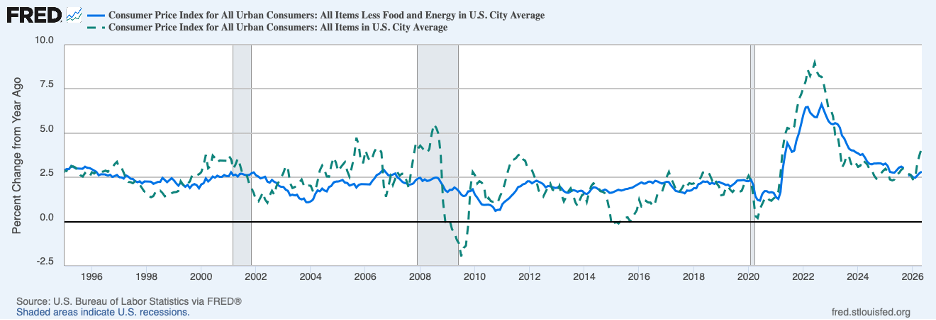
The situation is not so sanguine when it comes to inflation. The CPI registered another hefty increase in May, 0.5 percent, lifting the twelve-month reading to 4.2 percent from 3.8 percent in April and 3.4 percent a year earlier. The upturn in headline inflation can be seen by the broken green line in the following chart. As in other recent months, higher energy prices were the primary culprit. Removing energy and food prices, the core CPI increased only 0.2 percent. However, the twelve month-change, the solid blue line in the chart, rose from 2 .7 percent in April to 2.8 percent in May, unchanged from a year earlier — and still a good bit above the Fed’s 2 percent target.
Recent headline inflation has been boosted not only by the jump in energy prices but also by tariffs, both affecting prices of commodities. The next chart shows that the twelve-month increase in prices of commodities excluding energy and food, the solid blue line, continued at 1.1 percent in May; notably, this measure of commodities prices actually declined a touch over the months of April and May, suggesting that tariffs are no longer much of a factor boosting inflation.
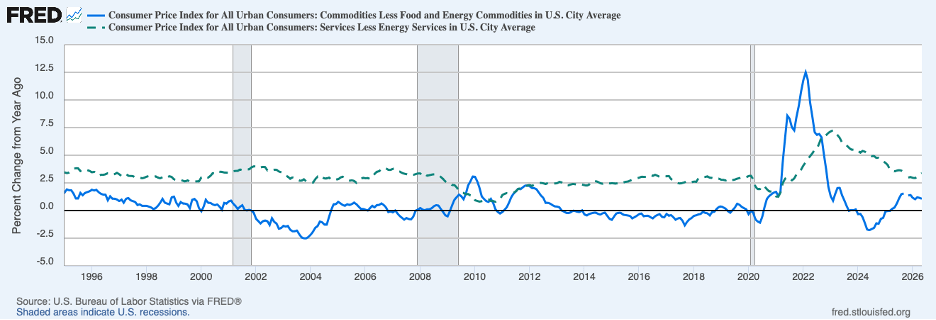
Service prices likely are giving a better indication of underlying inflation given the various forces buffeting prices of commodities. The twelve-month increase in service prices excluding energy, the broken green line, ticked up to 3.4 percent in May from 3.3 percent in April, little changed from a year earlier. The twelve-month increase in May was a full percentage point higher than the average annual increase over the decade preceding the pandemic. (A similar pattern is displayed when the rent of shelter component of service prices, which may have been distorting the service price index, is removed; inflation in service prices excluding rent of shelter has not slowed over the past year and is running much faster than during the period leading up to COVID.)
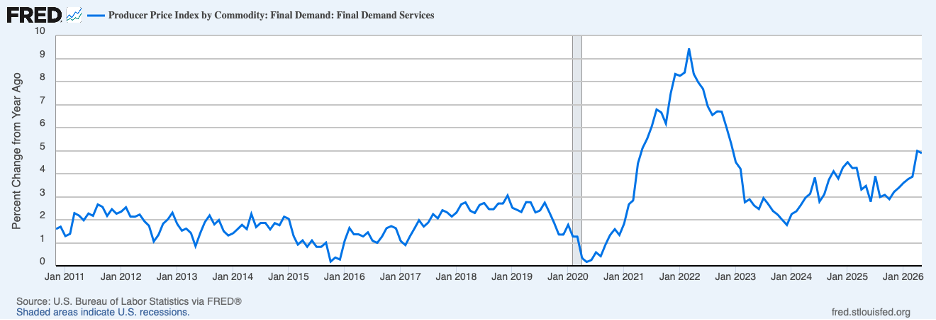
Stubborn inflation is evident in other recent data releases, too. Shown next are service prices in the Producer Price Index (PPI). The twelve-month increase in PPI service prices continued at around 5 percent in May, up from a year ago and well above the 1.8 percent pace during the years prior to the pandemic.
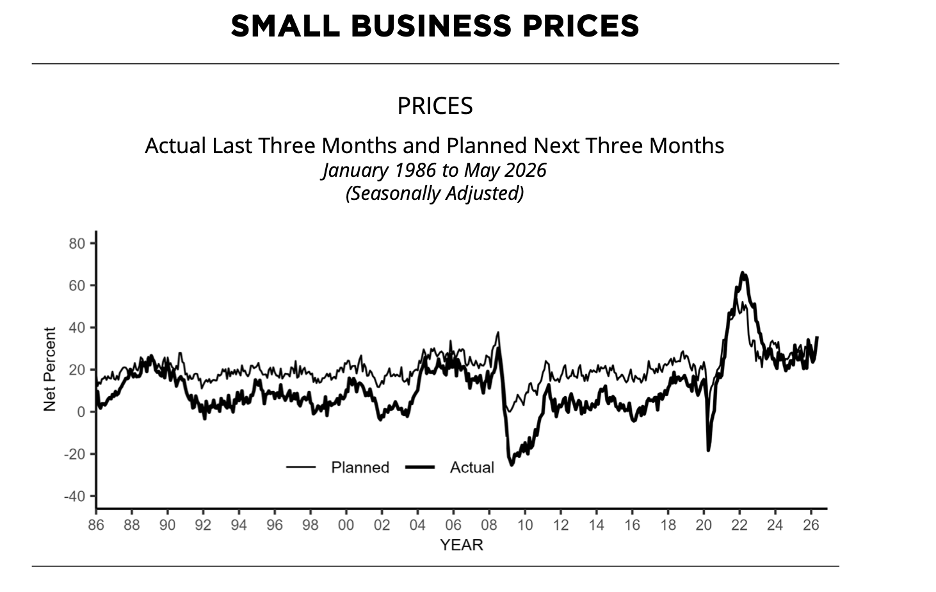
Similarly, a substantial portion of small businesses in the NFIB survey of small business continued to report that they have raised prices in the previous three months and plan to raise prices in the coming three months — the next chart.
In sum, inflation inertia continues at a time when jobs market is performing well; moreover, estimates of growth in output in the current quarter exceed the growth in potential output of 2 percent or so. The glass is either half empty or half full, depending on your perspective.
Nonetheless, the combination of a solid economy and above-target inflation implies that the Fed’s policy rate is too low. The prospects for achieving the dual mandate on a sustained basis require that underlying inflation be brought down to 2 percent — from the current vicinity of 3 percent. And the current roll-back of energy prices will not bring underlying inflation down. Bringing underlying inflation down will require action by the Fed and, unfortunately, will not happen on its own. The sooner the Fed gets started, the sooner the glass will again be full (the dual mandate achieved) and the table will be set for an extended period of prosperity.
Header image: Manki Kim / Unsplash
