
“A billion here, a billion there, and pretty soon you are talking about real money.”
Attributed to Senator Everett Dirksen (Illinois)
One wonders how Senator Dirksen might react to the current federal budget outlook, given the nearly $3 trillion of red ink that has been spilled so far in the 2020 fiscal year and the wrangling over whether to spend $1 to $3 trillion more. Indeed, the federal debt likely will grow nearly 20 percent this year from a level that was almost $23 trillion at the end of 2019. (1)
A few points are worth noting. First, the public debt will never be paid down. Instead, the Treasury will continue to roll over existing debt. In other words, it will replace maturing securities with newly issued ones. For example, the funds to pay the owner of a maturing ten-year note will come from the proceeds from selling a new ten-year note. Second, a better way to look at this issue is to look at debt as it compares to GDP—the chart below. (2) GDP represents the total amount of production in a period, such as a year, or the total amount of income earned in that year. It can be thought of as representing the tax base on which we collect federal tax revenues. The chart below has projections going out to 2050. Note that debt roughly matched GDP in recent years. But it has soared this year—both as borrowing has exploded and as GDP has contracted. Historically, debt has surged in times of war—note the previous peak in the mid-1940s—as wartime spending has jumped more than have tax receipts. Afterward, the debt-to-GDP ratio would retrace its surge.
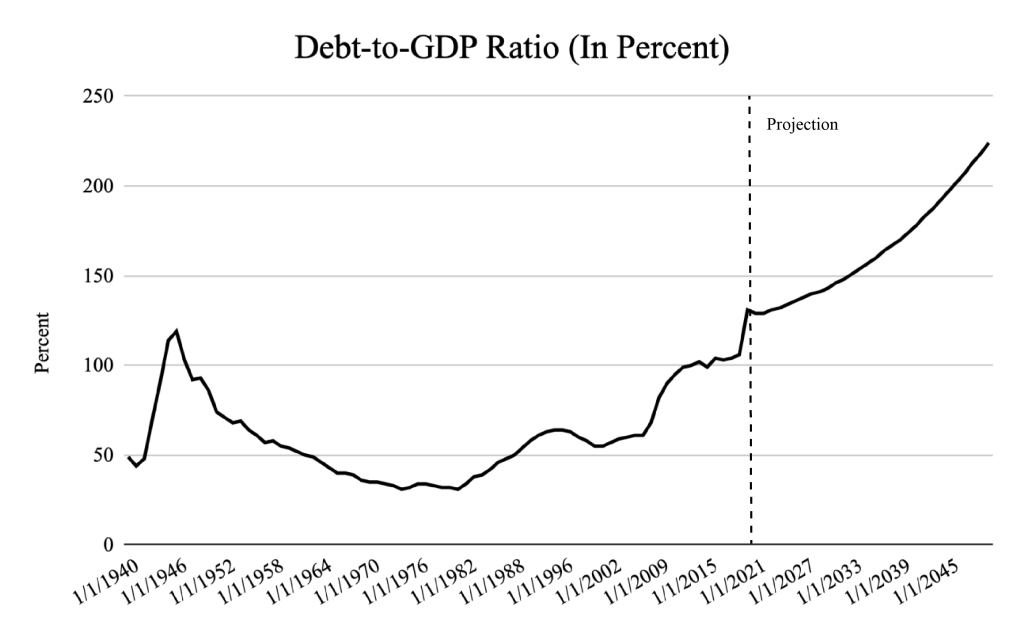
However, the projection does not embody such a reversal, but envisions further substantial increases. This is caused by spending for entitlement programs, such as social security, Medicare, and Medicaid, that make a bigger claim on the economy as the population ages.
Third, a more relevant measure of the fiscal strain is the debt-service ratio—the ratio of interest payments to GDP. That is, how much of the resources available to government has to be used to pay interest on federal debt. To illustrate, the debt-service ratio was 1.75 percent at the end of 2019—the product of an average interest rate on federal debt of a little less that 1.75 percent and a debt-to-GDP ratio of a little more that 100 percent. Despite the high level of debt to GDP, the debt-servicing burden of 1.75 percent is relatively low by historical standards because interest rates have been extremely low (see Buoying the Market: An Era of Ultra-Low Interest Rates, posted July 13, 2020).
No doubt this low debt-servicing burden has been enabling political leaders to look the other way in upping the ante for new fiscal initiatives that would boost debt by the trillions. They have not been facing the consequences of kicking the can further down the road. Indeed, they seem to have forgotten that these measures have to be paid for at some point. No one is offering a serious plan for limiting the pain on those who will be left holding the bag, either through higher taxes or reduced benefits. (3) This raises the odds of a fiscal crisis down the road that will require draconian increases in taxes or cuts in benefits.
The debt-servicing situation will be changing substantially over coming decades, even if no ambitious new fiscal programs are enacted (such as another round of tax cuts or an expansion of the federal government in health care). The debt-to-GDP ratio will rise from the 100 percent area at the end of 2019 to roughly 225 percent in 2050. If interest rates do not change, this means that interest servicing will climb from 1.75 percent to nearly 4 percent of GDP in 2050 and will require that we pay an additional 2.25 percent of GDP in taxes (or nearly 15 percent more than we have been paying). Alternatively, we would need to slash spending on other programs, such as reducing social security payments by more than one-third or federal health care programs by one-fourth. In any event, real pain will be inflicted.
This outlook presumes that interest rates are unchanged at extremely low levels. Should the average interest rate on federal debt increase one percentage point, to 2.75 percent, over this period—still very low historically—debt service would be 6.2 percent of GDP instead of 4 percent. In this case, tax payments would need to increase more than 25 percent or social security payments would need to be cut by more than half or federal health care by 40 percent.
The above scenario presumes that investors in Treasury securities believe that they will get repaid in full, as they always have. But as strains on the budget come into clearer focus, investors will come to realize that something will need to give. Moreover, the something that needs to give may be their repayment—that is, politicians may become more willing to default on the federal debt than to inflict more hardship on taxpayers or recipients of entitlements. Once this begins to unfold, interest rates that the Treasury has to pay will increase even more, and the day of reckoning will be brought closer in time. The Treasury will find that investor resistance will be greater for rolling over longer-term securities—accounting for about half of the total—than shorter-term securities, and interest rates will rise more sharply at the longer end of the maturity spectrum. As a consequence, the Treasury will be replacing maturing longer-term debt with shorter debt and rollovers will become more frequent. This means that increases in interest rates will get translated into a rising debt-servicing burden more promptly.
At some point, politicians will have their backs against the wall and will be facing a full-blown fiscal crisis that will require immediate action. The music will stop abruptly. In these circumstances, they will be driven to come up with a compromise package of substantial tax hikes and painful cuts in social security and health program entitlements. The time for dealing with the debt problem in a more orderly and balanced manner will have long passed. Moreover, the capacity of the federal government to respond to negative macroeconomic shocks that threaten a major loss of jobs will have been exhausted. If all of this seems far-fetched, ask someone who lived through the Greek fiscal crisis of a few years ago about what it’s like.
More on the consequences of a welfare state are explored in Chapter 5 of my new book—Capitalism Versus Socialism: What Does the Bible Have to Say?
(1) The amount presented here is gross federal debt and includes Treasury debt held by federal trust funds, such as social security. Another measure, Treasury debt held by the public, excludes such holdings and was a little more than $17 billion at the end of 2019.
(2) The chart is based on data from the Congressional Budget Office (CBO), The 2019 Long-Term Budget Outlook, June 2019. The CBO projection is based on existing law regarding spending and taxation and its long-term economic forecast. Adjustments have been made to reflect the extraordinary developments of 2020, notably the contraction in GDP and the surge in federal borrowing.
(3) In practice, the programs that will need to be cut are entitlement programs—social security and health care (mostly Medicare and Medicaid). There simply is not enough room for cutting discretionary programs, such as defense.
